
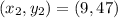
![\frac{y-y_1}{x-x_1}=]\frac{y_2-y_1}{x_2-x_1}](/tpl/images/0198/1423/4d7d0.png)


For 1983 through 1989, the per capita consumption of chicken in the u. s. increased at a
rate t...

Mathematics, 26.08.2019 03:20 chloe1107
For 1983 through 1989, the per capita consumption of chicken in the u. s. increased at a
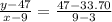
rate that was approximately linear. in 1983,
the per capita consumption was 33.7 pounds,
and in 1989 it was 47 pounds.
write a linear model for per capita consumption of chicken in the u. s. let t represent time in years, where t = 3 represents
1983. let y represent chicken consumption in
pounds.
1. y = t + 27.05
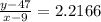
2. y = 2.21667t
3. y = 27.05
4. y = 2.21667t − 27.05
5. y = 2.21667t + 27.05

Answers: 3
Another question on Mathematics
Mathematics, 21.06.2019 16:00
If there is no real number solution to the quadratic equation x^2+2x+c=0 what is a possible value of c? 1 -2 0 3
Answers: 2
Mathematics, 21.06.2019 19:30
Find the 6th term of the expansion of (2p - 3q)11. a. -7,185,024p4q7 c. -7,185p4q7 b. -7,185,024p6q5 d. -7,185p6q5 select the best answer from the choices provided a b c d
Answers: 1
Mathematics, 21.06.2019 20:30
Create a question with this scenario you could ask that could be answered only by graphing or using logarithm. david estimated he had about 20 fish in his pond. a year later, there were about 1.5 times as many fish. the year after that, the number of fish increased by a factor of 1.5 again. the number of fish is modeled by f(x)=20(1.5)^x.
Answers: 1
You know the right answer?
Questions
Mathematics, 29.07.2019 00:00

History, 29.07.2019 00:00


History, 29.07.2019 00:00

Social Studies, 29.07.2019 00:00
History, 29.07.2019 00:00
English, 29.07.2019 00:00
History, 29.07.2019 00:00

English, 29.07.2019 00:00


