
Mathematics, 26.08.2019 22:10 michellemonroe012305
The graph of function g is shown below. use the graph to find the average rate of change from x=-7 to x=-5
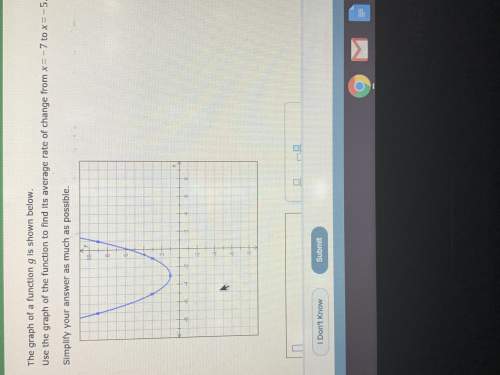

Answers: 3
Another question on Mathematics
Mathematics, 21.06.2019 20:30
Laura read 1/8 of a comic book in 2 days. she reads the same number of pages every day. what part of the book does she read in a week
Answers: 1
Mathematics, 21.06.2019 21:40
Use sigma notation to represent the following series for 9 terms.
Answers: 2
Mathematics, 22.06.2019 02:30
Apossible wavelength for the color blue is 0.000000492 meter. which of the following is a reasonable estimate for this wavelength for the color blue? a. 5 × 10⁻⁶ m b. 5 × 10⁷ m c. 5 × 10⁻⁷ m d. 5 × 10⁶ m
Answers: 2
You know the right answer?
The graph of function g is shown below. use the graph to find the average rate of change from x=-7 t...
Questions


Mathematics, 20.08.2019 09:20

Social Studies, 20.08.2019 09:20

English, 20.08.2019 09:20
Mathematics, 20.08.2019 09:20


Mathematics, 20.08.2019 09:20
Mathematics, 20.08.2019 09:20
English, 20.08.2019 09:30


