
Mathematics, 17.09.2019 23:00 aseel667789
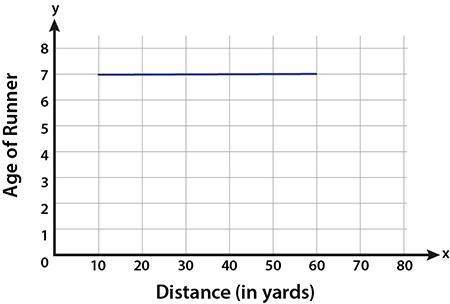
Seven-year-old students at an elementary school were given a 10-yard head start in a race. the graph shows how far the average student ran in 30 seconds.
which statement best describes the domain of the function represented in the graph?
a. 10 ≤ x ≤ 60, or x is from 10 to 60
b. 7 ≤ x ≤ 60, or x is from 7 to 60
c. 7 ≤ x ≤ 10, or x is from 7 to 10
d. 0 ≤ x ≤ 10, or x is from 0 to 10

Answers: 2
Another question on Mathematics
Mathematics, 21.06.2019 17:00
Use the frequency distribution, which shows the number of american voters (in millions) according to age, to find the probability that a voter chosen at random is in the 18 to 20 years old age range. ages frequency 18 to 20 5.9 21 to 24 7.7 25 to 34 20.4 35 to 44 25.1 45 to 64 54.4 65 and over 27.7 the probability that a voter chosen at random is in the 18 to 20 years old age range is nothing. (round to three decimal places as needed.)
Answers: 1
You know the right answer?
Seven-year-old students at an elementary school were given a 10-yard head start in a race. the graph...
Questions

Computers and Technology, 10.02.2020 23:57

Biology, 10.02.2020 23:57


History, 10.02.2020 23:57
Mathematics, 10.02.2020 23:57

Mathematics, 10.02.2020 23:57
History, 10.02.2020 23:57

Biology, 10.02.2020 23:57
Biology, 10.02.2020 23:57


