
5. the dot plot represents the distribution of wages earned during a one-week period
by 12 coll...

Mathematics, 23.09.2019 09:30 jfrey7621
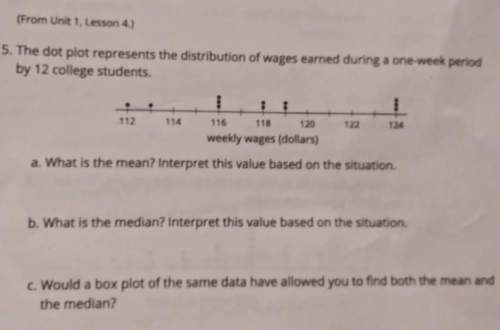
5. the dot plot represents the distribution of wages earned during a one-week period
by 12 college students.
. 112 114 116 118 120 122 124
weekly wages (dollars)
a. what is the mean? interpret this value based on the situation.
b. what is the median? interpret this value based on the situation.
c. would a box plot of the same data have allowed you to find both the mean and
the median?

Answers: 1
Another question on Mathematics
Mathematics, 21.06.2019 19:30
For what values of the variable x is the expression square root of 7x+14+ square root of 7-x a real number?
Answers: 1
Mathematics, 21.06.2019 20:50
Afarmer has a large field that is x feet in length. he wants to fence in a rectangular section in the middle of the field , leaving a length of 100 feet of open field behind each end of the fenced rectangle.he also wants the width of the fenced-in space to be 100 feet less than its length. find the expressions to represent the length and width of the fenced section of the field
Answers: 2
Mathematics, 22.06.2019 02:30
Atrain traveled for 1.5 hours to the first station, stopped for 30 minutes, then traveled for 4 hours to the final station where it stopped for 1 hour. the total distance traveled is a function of time. which graph most accurately represents this scenario? a graph is shown with the x-axis labeled time (in hours) and the y-axis labeled total distance (in miles). the line begins at the origin and moves upward for 1.5 hours. the line then continues upward at a slow rate until 2 hours. from 2 to 6 hours, the line continues quickly upward. from 6 to 7 hours, it moves downward until it touches the x-axis a graph is shown with the axis labeled time (in hours) and the y axis labeled total distance (in miles). a line is shown beginning at the origin. the line moves upward until 1.5 hours, then is a horizontal line until 2 hours. the line moves quickly upward again until 6 hours, and then is horizontal until 7 hours a graph is shown with the axis labeled time (in hours) and the y-axis labeled total distance (in miles). the line begins at the y-axis where y equals 125. it is horizontal until 1.5 hours, then moves downward until 2 hours where it touches the x-axis. the line moves upward until 6 hours and then moves downward until 7 hours where it touches the x-axis a graph is shown with the axis labeled time (in hours) and the y-axis labeled total distance (in miles). the line begins at y equals 125 and is horizontal for 1.5 hours. the line moves downward until 2 hours, then back up until 5.5 hours. the line is horizontal from 5.5 to 7 hours
Answers: 1
You know the right answer?
Questions


Mathematics, 28.01.2020 21:53

History, 28.01.2020 21:54
Mathematics, 28.01.2020 21:54
English, 28.01.2020 21:54
Health, 28.01.2020 21:54
History, 28.01.2020 21:54
Mathematics, 28.01.2020 21:54

Biology, 28.01.2020 21:54
Mathematics, 28.01.2020 21:54

Chemistry, 28.01.2020 21:54


