Determine the intervals on which the function is increasing, decreasing, and constant.
a coord...

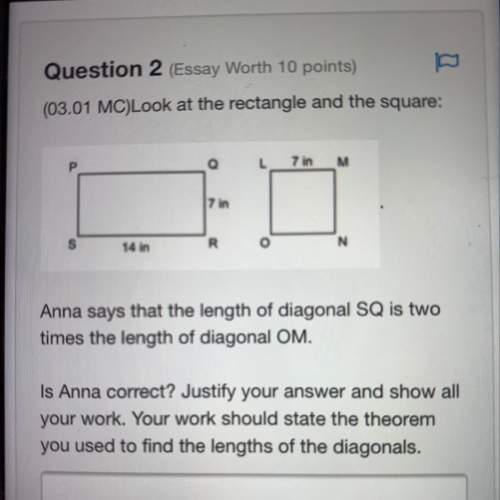
Mathematics, 29.09.2019 02:30 lolz55678
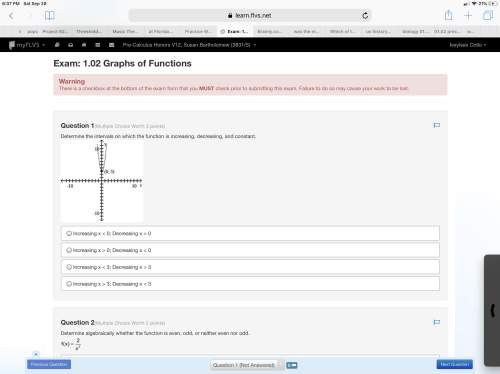
Determine the intervals on which the function is increasing, decreasing, and constant.
a coordinate axis is drawn with a parabola pointing up that has vertex of 0,3.
a. increasing x < 0; decreasing x > 0
b. increasing x > 0; decreasing x < 0
c. increasing x < 3; decreasing x > 3
d. increasing x > 3; decreasing x < 3

Answers: 1
Another question on Mathematics
Mathematics, 21.06.2019 16:10
To find the extreme values of a function f(x.y) on a curve x-x(t), y y(t), treat f as a function of the single variable t and use the chain rule to find where df/dt is zero. in any other single-variable case, the extreme values of f are then found among the values at the critical points (points where df/dt is zero or fails to exist), and endpoints of the parameter domain. find the absolute maximum and minimum values of the following function on the given curves. use the parametric equations x=2cos t, y 2 sin t functions: curves: i) the semicircle x4,y20 i) the quarter circle x2+y-4, x20, y20 b, g(x,y)=xy
Answers: 2
Mathematics, 21.06.2019 18:00
The swimming pool is open when the high temperature is higher than 20∘c. lainey tried to swim on monday and thursday (which was 3 days later). the pool was open on monday, but it was closed on thursday. the high temperature was 30∘c on monday, but decreased at a constant rate in the next 3 days. write an inequality to determine the rate of temperature decrease in degrees celsius per day, d, from monday to thursday.
Answers: 1
Mathematics, 21.06.2019 20:30
3.17 scores on stats final. below are final exam scores of 20 introductory statistics students. 1 2 3 4 5 6 7 8 9 10 11 12 13 14 15 16 17 18 19 20 57, 66, 69, 71, 72, 73, 74, 77, 78, 78, 79, 79, 81, 81, 82, 83, 83, 88, 89, 94 (a) the mean score is 77.7 points. with a standard deviation of 8.44 points. use this information to determine if the scores approximately follow the 68-95-99.7% rule. (b) do these data appear to follow a normal distribution? explain your reasoning using the graphs provided below.
Answers: 1
Mathematics, 21.06.2019 21:30
Mon wants to make 5 lbs of the sugar syrup. how much water and how much sugar does he need… …to make 5% syrup?
Answers: 2
You know the right answer?
Questions
Mathematics, 15.10.2020 23:01


Chemistry, 15.10.2020 23:01
History, 15.10.2020 23:01
History, 15.10.2020 23:01

English, 15.10.2020 23:01

Health, 15.10.2020 23:01


History, 15.10.2020 23:01
History, 15.10.2020 23:01
Mathematics, 15.10.2020 23:01


