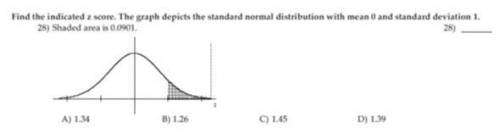
Find the indicated z score. the graph depicts the standard normal
distribution with mean 0 and...

Mathematics, 03.10.2019 02:10 gamingisfun
Find the indicated z score. the graph depicts the standard normal
distribution with mean 0 and standard deviation 1.
shaded area is 0.0901.
01.45
01.26
01.39
01.34

Answers: 1
Another question on Mathematics
Mathematics, 21.06.2019 14:30
Describe in detail how you would construct a 95% confidence interval for a set of 30 data points whose mean is 20 and population standard deviation is 3. be sure to show that you know the formula and how to plug into it. also, clearly state the margin of error.
Answers: 3
Mathematics, 21.06.2019 16:10
To find the extreme values of a function f(x.y) on a curve x-x(t), y y(t), treat f as a function of the single variable t and use the chain rule to find where df/dt is zero. in any other single-variable case, the extreme values of f are then found among the values at the critical points (points where df/dt is zero or fails to exist), and endpoints of the parameter domain. find the absolute maximum and minimum values of the following function on the given curves. use the parametric equations x=2cos t, y 2 sin t functions: curves: i) the semicircle x4,y20 i) the quarter circle x2+y-4, x20, y20 b, g(x,y)=xy
Answers: 2
Mathematics, 21.06.2019 18:30
Water flows at a steady rate from a tap. its takes 40 seconds to fill a 4 litre watering can from the tap. the rate at which water flows from the tap is halved. complete: 4 litres into cm3
Answers: 3
Mathematics, 21.06.2019 19:30
Acourt reporter is transcribing an accident report from germany. the report states that the driver was traveling 80 kilometers per hour. how many miles per hour was the driver traveling?
Answers: 2
You know the right answer?
Questions

Chemistry, 12.07.2019 21:50

Biology, 12.07.2019 21:50
Biology, 12.07.2019 21:50
Mathematics, 12.07.2019 21:50


Social Studies, 12.07.2019 21:50
Social Studies, 12.07.2019 21:50

Social Studies, 12.07.2019 21:50
Social Studies, 12.07.2019 21:50

Physics, 12.07.2019 21:50


