
Mathematics, 10.10.2019 02:00 goodluck99
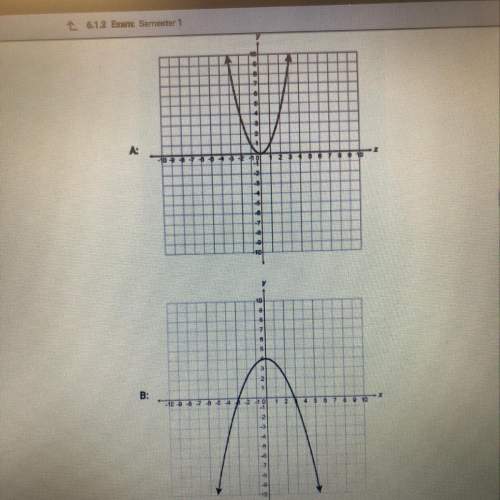
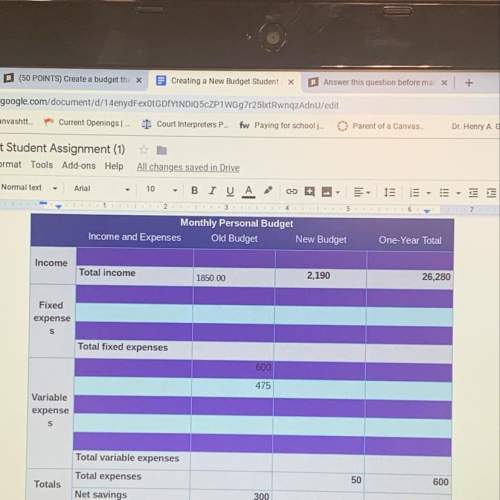
In two or more complete sentences, compare the number of x-intercepts in the graph of f(x) = x2 to the number of x-intercepts in the graph of g(x) = -x2 +7. be sure to include the transformations that occurred between the parent function f(x) and its image g(x).

Answers: 3
Another question on Mathematics
Mathematics, 21.06.2019 22:30
Amachine that produces a special type of transistor (a component of computers) has a 2% defective rate. the production is considered a random process where each transistor is independent of the others. (a) what is the probability that the 10th transistor produced is the first with a defect? (b) what is the probability that the machine produces no defective transistors in a batch of 100? (c) on average, how many transistors would you expect to be produced before the first with a defect? what is the standard deviation? (d) another machine that also produces transistors has a 5% defective rate where each transistor is produced independent of the others. on average how many transistors would you expect to be produced with this machine before the first with a defect? what is the standard deviation? (e) based on your answers to parts (c) and (d), how does increasing the probability of an event a↵ect the mean and standard deviation of the wait time until success?
Answers: 3
Mathematics, 22.06.2019 00:30
Tim has obtained a 3/27 balloon mortgage. after the initial period, he decided to refinance the balloon payment with a new 30-year mortgage. how many years will he be paying for his mortgage in total?
Answers: 2
Mathematics, 22.06.2019 01:00
Suppose m: angle a =77 degrees what is the measure of a complement of a complement of angle a, what is a conclusion you can draw about a complement of a complement of an angle
Answers: 1
Mathematics, 22.06.2019 01:20
1. why is a frequency distribution useful? it allows researchers to see the "shape" of the data. it tells researchers how often the mean occurs in a set of data. it can visually identify the mean. it ignores outliers. 2. the is defined by its mean and standard deviation alone. normal distribution frequency distribution median distribution marginal distribution 3. approximately % of the data in a given sample falls within three standard deviations of the mean if it is normally distributed. 95 68 34 99 4. a data set is said to be if the mean of the data is greater than the median of the data. normally distributed frequency distributed right-skewed left-skewed
Answers: 2
You know the right answer?
In two or more complete sentences, compare the number of x-intercepts in the graph of f(x) = x2 to t...
Questions

Computers and Technology, 25.03.2021 17:20

Spanish, 25.03.2021 17:20
Mathematics, 25.03.2021 17:20

Social Studies, 25.03.2021 17:20

Chemistry, 25.03.2021 17:20

History, 25.03.2021 17:20
Mathematics, 25.03.2021 17:20
Mathematics, 25.03.2021 17:20
Mathematics, 25.03.2021 17:20


Physics, 25.03.2021 17:20
Mathematics, 25.03.2021 17:20
Chemistry, 25.03.2021 17:20
Mathematics, 25.03.2021 17:20


