Part 1:
the table below displays a small portion of the infinite domain of the exponential fu...

Mathematics, 14.10.2019 07:10 kittycat79
Part 1:
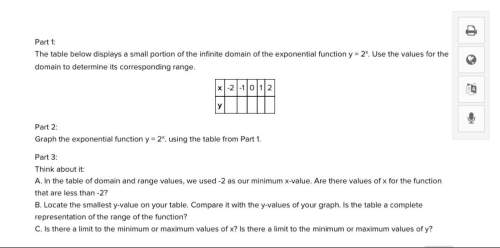
the table below displays a small portion of the infinite domain of the exponential function y = 2x. use the values for the domain to determine its corresponding range.
x -2 -1 0 1 2
y
part 2:
graph the exponential function y = 2x. using the table from part 1.
part 3:
think about it:
a. in the table of domain and range values, we used -2 as our minimum x-value. are there values of x for the function that are less than -2?
b. locate the smallest y-value on your table. compare it with the y-values of your graph. is the table a complete representation of the range of the function?
c. is there a limit to the minimum or maximum values of x? is there a limit to the minimum or maximum values of y?

Answers: 1
Another question on Mathematics
Mathematics, 21.06.2019 20:00
Choose the linear inequality that describes the graph. the gray area represents the shaded region. a: y ≤ –4x – 2 b: y > –4x – 2 c: y ≥ –4x – 2 d: y < 4x – 2
Answers: 2
Mathematics, 22.06.2019 02:10
How many roots does the graphed polynomial function have? 1-02
Answers: 1
You know the right answer?
Questions


Computers and Technology, 31.12.2019 03:31
Computers and Technology, 31.12.2019 03:31


