
Mathematics, 18.10.2019 01:00 NotYourStudent
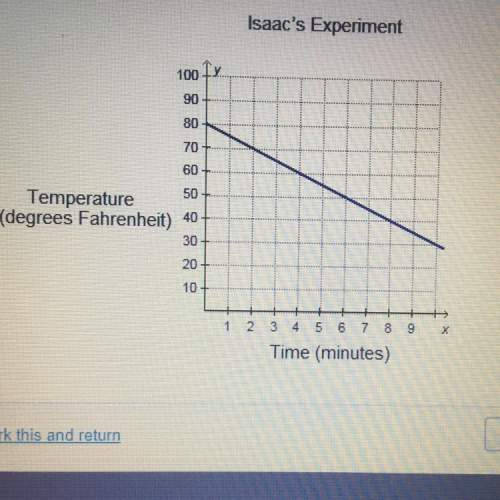
Isaac and sakura are both doing a science experiment where they are measuring the temperature of a liquid over time.
graphs that represent each of their data are shown below.
which statement is correct?
a. the slope of the graph that represents isaacs data is positive and the slope of the graph that represents sakura’s data is positive.
b. the slope of the graph that represents isaacs data is positive and the slope of the graph that represents sakura’s data is negative
c. the slope of the graph that represents isaacs data is negative and the slope of the graph that represents sakura’s data is positive
d. the slope of the graph that represents isaacs data is negative and the slope of the graph that represents sakura’s data is negative

Answers: 1
Another question on Mathematics
Mathematics, 21.06.2019 19:50
Raj encoded a secret phrase using matrix multiplication. using a = 1, b = 2, c = 3, and so on, he multiplied the clear text code for each letter by the matrix to get a matrix that represents the encoded text. the matrix representing the encoded text is . what is the secret phrase? determine the location of spaces after you decode the text. yummy is the corn the tomato is red the corn is yummy red is the tomato
Answers: 2
Mathematics, 21.06.2019 23:30
In a study of the relationship between socio-economic class and unethical behavior, 129 university of california undergraduates at berkeley were asked to identify themselves as having low or high social-class by comparing themselves to others with the most (least) money, most (least) education, and most (least) respected jobs. they were also presented with a jar of individually wrapped candies and informed that the candies were for children in a nearby laboratory, but that they could take some if they wanted. after completing some unrelated tasks, participants reported the number of candies they had taken. it was found that those who were identiď¬ed as upper-class took more candy than others. in this study, identify: (a) the cases, (b) the variables and their types, (c) the main research question, (d) identify the population of interest and the sample in this study, and (e) comment on whether or not the results of the study can be generalized to the population, and if the ď¬ndings of the study can be used to establish causal relationships.
Answers: 2
Mathematics, 22.06.2019 00:00
Suppose that g(x)=f(x+9) which statement best compares the graph of g(x) with the graph of f(x)
Answers: 3
Mathematics, 22.06.2019 01:30
In a rectangle klmn, km = 6x + 16 and ln = 49. find the value of x
Answers: 1
You know the right answer?
Isaac and sakura are both doing a science experiment where they are measuring the temperature of a l...
Questions

Mathematics, 31.08.2020 19:01
Mathematics, 31.08.2020 19:01

Social Studies, 31.08.2020 19:01
Mathematics, 31.08.2020 19:01
Mathematics, 31.08.2020 19:01

Geography, 31.08.2020 19:01

Mathematics, 31.08.2020 19:01
Mathematics, 31.08.2020 19:01

Chemistry, 31.08.2020 19:01
Mathematics, 31.08.2020 19:01
Mathematics, 31.08.2020 19:01

English, 31.08.2020 19:01


