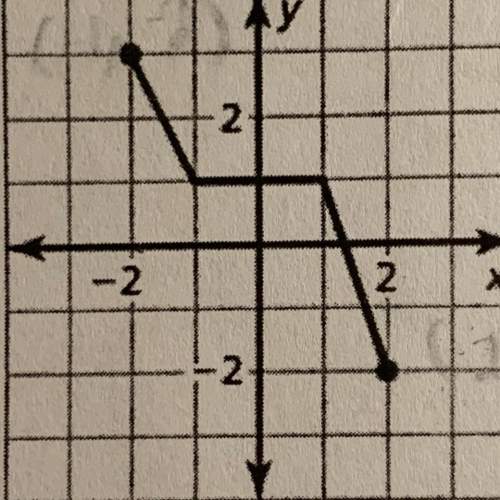
Find the domain and range of the function represented by the graph.
...

Mathematics, 22.10.2019 02:00 rustalex6045
Find the domain and range of the function represented by the graph.

Answers: 1
Another question on Mathematics
Mathematics, 21.06.2019 17:40
Afamily of five rents a kayak and splits the total time, k, equally. each family member spent less than 25 minutes kayaking. which values can be used to complete the math sentence below so that it accurately represents the situation? intro done
Answers: 2
Mathematics, 21.06.2019 18:30
Apsychology student wishes to investigate differences in political opinions between business majors and political science majors at her college. she randomly selects 100 students from the 260 business majors and 100 students from the 180 political science majors. does this sampling plan result in a simple random sample? why or why not? no, because each group of 200 students in the sample does not have the same chance of being selected. yes, because each group of 200 students in the sample has the same chance of being selected. no, because each individual student does not have an equal chance of being selected. yes, because each individual student has the same chance of being selected.
Answers: 1
Mathematics, 21.06.2019 22:00
Asquare and an equilateral triangle have the same perimeter. each side the triangle is 4 inches longer than each side of the square. what is the perimeter of the square
Answers: 1
Mathematics, 21.06.2019 22:50
Listed below are time intervals (min) between eruptions of a geyser. assume that the "recent" times are within the past few years, the "past" times are from around 20 years ago, and that the two samples are independent simple random samples selected from normally distributed populations. do not assume that the population standard deviations are equal. does it appear that the mean time interval has changed? is the conclusion affected by whether the significance level is 0.10 or 0.01? recent 78 90 90 79 57 101 62 87 71 87 81 84 57 80 74 103 62 past 88 89 93 94 65 85 85 92 87 91 89 91 follow the steps of hypothesis testing, including identifying the alternative and null hypothesis, calculating the test statistic, finding the p-value, and making a conclusions about the null hypothesis and a final conclusion that addresses the original claim. use a significance level of 0.10. is the conclusion affected by whether the significance level is 0.10 or 0.01? answer choices below: a) yes, the conclusion is affected by the significance level because h0 is rejected when the significance level is 0.01 but is not rejected when the significance level is 0.10. b) no, the conclusion is not affected by the significance level because h0 is not rejected regardless of whether a significance level of 0.10 or 0.01 is used. c) yes, the conclusion is affected by the significance level because h0 is rejected when the significance level is 0.10 but is not rejected when the significance level is 0.01. d) no, the conclusion is not affected by the significance level because h0 is rejected regardless of whether a significance level of 0.10 or 0.01 is used.
Answers: 3
You know the right answer?
Questions
Mathematics, 02.11.2020 14:00
Mathematics, 02.11.2020 14:00


Social Studies, 02.11.2020 14:00


History, 02.11.2020 14:00
Mathematics, 02.11.2020 14:00

Computers and Technology, 02.11.2020 14:00

Advanced Placement (AP), 02.11.2020 14:00

Geography, 02.11.2020 14:00


