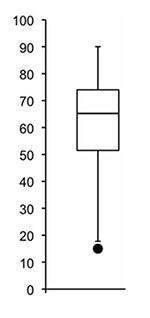
Which of the following is true of the data represented by the box plot?
a. the data is...

Mathematics, 23.10.2019 05:00 dondre54
Which of the following is true of the data represented by the box plot?
a. the data is skewed to the bottom and contains one outlier.
b. the data is skewed to the top.
c. the data has a symmetrical distribution and contains no outliers.
d. the mean is most likely greater than the median.


Answers: 3
Another question on Mathematics


Mathematics, 21.06.2019 22:00
Out of 50 students surveyed, 16 have a dog. based on these results, predict how many of the 280 students in the school have a dog.
Answers: 2

Mathematics, 21.06.2019 22:30
How can you find the mean absolute deviation (mad) for this set of data?
Answers: 3

Mathematics, 21.06.2019 23:40
Find the amplitude of a sinusoidal function that models this temperature variation
Answers: 2
You know the right answer?
Questions

Social Studies, 01.08.2019 22:40


English, 01.08.2019 22:40


Biology, 01.08.2019 22:40

Computers and Technology, 01.08.2019 22:40

Computers and Technology, 01.08.2019 22:40


Social Studies, 01.08.2019 22:40

Biology, 01.08.2019 22:40


Mathematics, 01.08.2019 22:40


