
Mathematics, 24.10.2019 01:00 mathwiznot45
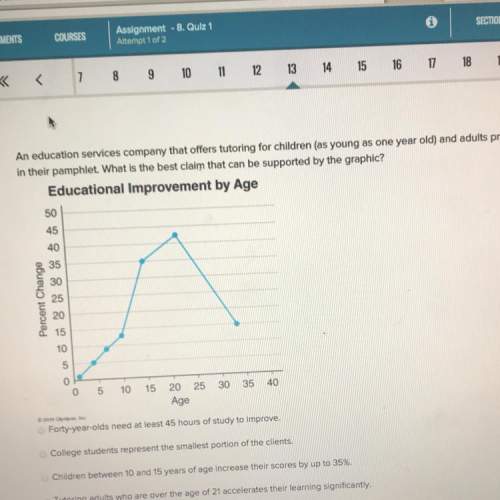
An education services company that offers tutoring for children (as young as one year old) and adults presents a graphic
in their pamphlet what is the best claim that can be supported by the graphic?
educational improvement by age
percent change
0
5
10
15
25
30
35
40
20
age
forty year-olds need at least 45 hours of study to improve.
college students represent the smallest portion of the clients.
children between 10 and 15 years of age increase their scores by up to 35%
tutoring adults who are over the age of 21 accelerates their learning significantly

Answers: 1
Another question on Mathematics
Mathematics, 20.06.2019 18:02
Show me how you find y and determine what y is you i appreciate it : )
Answers: 1
Mathematics, 21.06.2019 18:30
The table shows the relationship between the number of cups of cereal and the number of cups of raisins in a cereal bar recipe: number of cups of cereal number of cups of raisins 8 2 12 3 16 4 molly plotted an equivalent ratio as shown on the grid below: a graph is shown. the title of the graph is cereal bars. the horizontal axis label is cereal in cups. the x-axis values are 0, 20, 40, 60, 80,100. the vertical axis label is raisins in cups. the y-axis values are 0, 10, 20, 30, 40, 50. a point is plotted on the ordered pair 40,20. which of these explains why the point molly plotted is incorrect? (a) if the number of cups of cereal is 40, then the number of cups of raisins will be10. (b)if the number of cups of raisins is 40, then the number of cups of cereal will be10. (c) if the number of cups of cereal is 40, then the number of cups of raisins will be 80. (d) if the number of cups of raisins is 40, then the number of cups of cereal will be 80.
Answers: 1
Mathematics, 21.06.2019 20:30
3.17 scores on stats final. below are final exam scores of 20 introductory statistics students. 1 2 3 4 5 6 7 8 9 10 11 12 13 14 15 16 17 18 19 20 57, 66, 69, 71, 72, 73, 74, 77, 78, 78, 79, 79, 81, 81, 82, 83, 83, 88, 89, 94 (a) the mean score is 77.7 points. with a standard deviation of 8.44 points. use this information to determine if the scores approximately follow the 68-95-99.7% rule. (b) do these data appear to follow a normal distribution? explain your reasoning using the graphs provided below.
Answers: 1
Mathematics, 21.06.2019 20:30
Clarence wants to buy a new car. he finds an ad for a car that costs 27,200 dollars. suppose his local sales tax is 7%. -how much would he have to pay? -what is the cost of the car including tax? -if clarence has 29,864 saved, can he pay cash to buy the car?
Answers: 1
You know the right answer?
An education services company that offers tutoring for children (as young as one year old) and adult...
Questions

Mathematics, 30.01.2020 00:54


Mathematics, 30.01.2020 00:55
Biology, 30.01.2020 00:55
Mathematics, 30.01.2020 00:55
History, 30.01.2020 00:55

Mathematics, 30.01.2020 00:55
Mathematics, 30.01.2020 00:55

Business, 30.01.2020 00:55
Mathematics, 30.01.2020 00:55


