
Mathematics, 25.10.2019 20:43 hannahbannana98
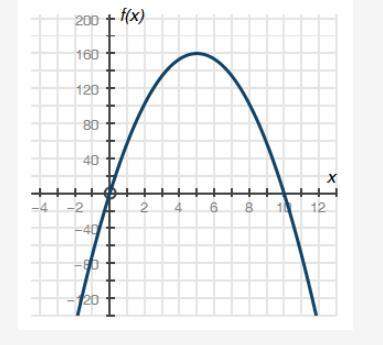
The graph below shows a company's profit f(x), in dollars, depending on the price of pencils x, in dollars, being sold by the company:
part a: what do the x-intercepts and maximum value of the graph represent? what are the intervals where the function is increasing and decreasing, and what do they represent about the sale and profit? (6 points)
part b: what is an approximate average rate of change of the graph from x = 2 to x = 5, and what does this rate represent? (4 points)

Answers: 1
Another question on Mathematics
Mathematics, 21.06.2019 17:00
100 points, hi, i’m not sure what to do here,the data doesn’t seem to be quadratic .? can anyone me, in advance
Answers: 2
Mathematics, 21.06.2019 19:30
If chord ab is congruent to chord cd, then what must be true about ef and eg?
Answers: 1
Mathematics, 21.06.2019 20:20
Each person in an it department of 25 people works on at least one of 3 major projects: system security, program implementation, platform development. 10 people work on system security, 13 work on program implementation, and 12 work on platform development. 4 people work on system security and platform development, 5 people work on program implementation and platform development, and 2 people work on all three projects. how many people work on system security and program implementation?
Answers: 1
You know the right answer?
The graph below shows a company's profit f(x), in dollars, depending on the price of pencils x, in d...
Questions

Social Studies, 25.08.2020 19:01

Biology, 25.08.2020 19:01
Mathematics, 25.08.2020 19:01

English, 25.08.2020 19:01

Geography, 25.08.2020 19:01
English, 25.08.2020 19:01

Physics, 25.08.2020 19:01
Mathematics, 25.08.2020 19:01
Mathematics, 25.08.2020 19:01
Mathematics, 25.08.2020 19:01
Social Studies, 25.08.2020 19:01
English, 25.08.2020 19:01
Social Studies, 25.08.2020 19:01
Mathematics, 25.08.2020 19:01
Physics, 25.08.2020 19:01


