
Mathematics, 04.11.2019 04:31 alyo31500
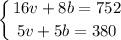
The local amusement park is a popular field trip destinations. this year the senior class at high school a and the senior class in high school b both planned trips there. the senior class at high school a rented and filled 16 vans and 8 buses with 752 students. high school b rented and filled 5 vans and 5 buses with 380 students. each van and each bus carried the same number of students. how many students can a van carry? how many students can a bus carry?

Answers: 1


Another question on Mathematics
Mathematics, 21.06.2019 19:20
Which letters from the table represent like terms? a and b b and c a and d b and d
Answers: 3
Mathematics, 21.06.2019 23:00
Acarton of juice contains 64 ounces miss wilson bought six cartons of juice how many ounces of juice did she buy
Answers: 2
Mathematics, 22.06.2019 01:50
If its non of them tell me..valerie took a day-trip. she drove from her house for a while and took a coffee break. after her coffee break, she continued driving. after 2 hours of driving after her coffee break, her distance from her house was 210 miles. her average speed during the whole trip was 60 miles per hour.valerie created the equation y−210=60(x−2) to represent this situation, where xx represents the time in hours from her coffee break and yy represents the distance in miles from her house.which graph correctly represents valerie's distance from her house after her coffee break?
Answers: 1
Mathematics, 22.06.2019 02:30
Atrain traveled for 1.5 hours to the first station, stopped for 30 minutes, then traveled for 4 hours to the final station where it stopped for 1 hour. the total distance traveled is a function of time. which graph most accurately represents this scenario? a graph is shown with the x-axis labeled time (in hours) and the y-axis labeled total distance (in miles). the line begins at the origin and moves upward for 1.5 hours. the line then continues upward at a slow rate until 2 hours. from 2 to 6 hours, the line continues quickly upward. from 6 to 7 hours, it moves downward until it touches the x-axis a graph is shown with the axis labeled time (in hours) and the y axis labeled total distance (in miles). a line is shown beginning at the origin. the line moves upward until 1.5 hours, then is a horizontal line until 2 hours. the line moves quickly upward again until 6 hours, and then is horizontal until 7 hours a graph is shown with the axis labeled time (in hours) and the y-axis labeled total distance (in miles). the line begins at the y-axis where y equals 125. it is horizontal until 1.5 hours, then moves downward until 2 hours where it touches the x-axis. the line moves upward until 6 hours and then moves downward until 7 hours where it touches the x-axis a graph is shown with the axis labeled time (in hours) and the y-axis labeled total distance (in miles). the line begins at y equals 125 and is horizontal for 1.5 hours. the line moves downward until 2 hours, then back up until 5.5 hours. the line is horizontal from 5.5 to 7 hours
Answers: 1
You know the right answer?
The local amusement park is a popular field trip destinations. this year the senior class at high sc...
Questions
Mathematics, 12.12.2019 02:31
Mathematics, 12.12.2019 02:31
Mathematics, 12.12.2019 02:31

Biology, 12.12.2019 02:31
Mathematics, 12.12.2019 02:31


Arts, 12.12.2019 02:31
Mathematics, 12.12.2019 02:31


Mathematics, 12.12.2019 02:31
Mathematics, 12.12.2019 02:31
Mathematics, 12.12.2019 02:31

Mathematics, 12.12.2019 02:31


