
![[0, 3],](/tpl/images/0359/9960/32614.png) you do
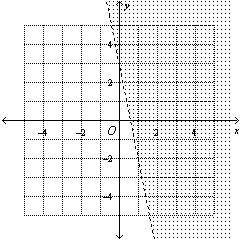
you do  by either moving five blocks north over one block west or five blocks south over one block east [west and south are negatives], then you shade everything to the right of the line because using the zero-interval test, also known as the test point [origin], we can determine what side of a line to shade. This is done by plugging "0" in for both y and x, then determining whether false or true will tell you which side to shade. In this case, we shade to the right of the line because when we plug the test point into the function, we get this false statement:
Choose the linear inequality that describes each graph.
y > – 5x + 3
y &...

Mathematics, 05.11.2019 04:31 19zmurphy
Choose the linear inequality that describes each graph.
y > – 5x + 3
y > – 5x – 3
y < – 5x + 3
y > – 3x + 5

Answers: 3
Another question on Mathematics
Mathematics, 21.06.2019 15:00
Which represents the inverse of the function f(x) = 4x? h(x) = x + 4 h(x) = x – 4 h(x) = x h(x) = x
Answers: 1
Mathematics, 21.06.2019 18:30
Which statement describes surface features called maria on the moon
Answers: 3
Mathematics, 22.06.2019 00:30
Julie begins counting backwards from 1000 by 2’s and at the same time tony begins counting forward from 100 by 3’s. if they count at the same rate, what number will they say at the same time?
Answers: 1
You know the right answer?
Questions
Mathematics, 27.10.2020 05:30

Spanish, 27.10.2020 05:30

English, 27.10.2020 05:30
Mathematics, 27.10.2020 05:30

Advanced Placement (AP), 27.10.2020 05:30
English, 27.10.2020 05:30
Mathematics, 27.10.2020 05:30

Computers and Technology, 27.10.2020 05:30
Mathematics, 27.10.2020 05:30


English, 27.10.2020 05:30
English, 27.10.2020 05:30


Mathematics, 27.10.2020 05:30


