The correct option is c
Step-by-step explanation:
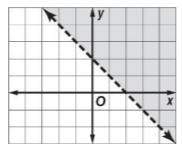
From the graph shown in the given figure, we need to find the equation of the line. We will use the slope intercept equation to get the equation if the line.
Formula for slope intercept equation is
y = mx + c
where m is the slope and c is the intercept.
Slope, m = (change in value of y) / (change in value of x)
Slope = (y2 -y1) / (x2 -x2)
From the graph,
y2 = 0, y1 = 2
x2 = 2, x1 = 0
Slope, m= (0-2) / (2-0) = -2/2 = -1
Intercept from the graph is the point at which the line cuts the y axis an it is 2
So the equation is
y = -x + 2
From the graph,
The upper region was shaded( which means the lower region satisfies the equation) and the line of the equation is broken. So the equation is y lesser than -x + 2
The correct option is c