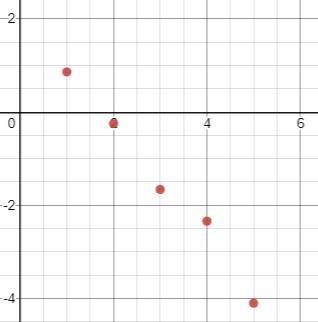
Use the graphing calculator tool to plot the residual points.
(1, 0.86), (2, –0.25), (3,...

Mathematics, 03.02.2020 22:48 screamqueen
Use the graphing calculator tool to plot the residual points.
(1, 0.86), (2, –0.25), (3, –1.66), (4, –2.34), (5, –4.1)
does the residual plot show that the line of best fit is appropriate for the data?
yes, the points have no pattern.
yes, the points are evenly distributed about the x-axis.
no, the points are in a linear pattern.
no, the points are in a curved pattern.

Answers: 1
Another question on Mathematics
Mathematics, 21.06.2019 16:00
Data are collected to see how many ice-cream cones are sold at a ballpark in a week. day 1 is sunday and day 7 is the following saturday. use the data from the table to create a scatter plot.
Answers: 2
Mathematics, 21.06.2019 18:20
The first-serve percentage of a tennis player in a match is normally distributed with a standard deviation of 4.3%. if a sample of 15 random matches of the player is taken, the mean first-serve percentage is found to be 26.4%. what is the margin of error of the sample mean? a. 0.086% b. 0.533% c. 1.11% d. 2.22%
Answers: 1
Mathematics, 21.06.2019 20:30
The function v(r)=4/3pir^3 can be used to find the volume of air inside a basketball given its radius. what does v(r) represent
Answers: 1
You know the right answer?
Questions
Mathematics, 20.09.2020 23:01
Mathematics, 20.09.2020 23:01
Mathematics, 20.09.2020 23:01

English, 20.09.2020 23:01


History, 20.09.2020 23:01
English, 20.09.2020 23:01

Spanish, 20.09.2020 23:01

Geography, 20.09.2020 23:01
Mathematics, 20.09.2020 23:01

Health, 20.09.2020 23:01
Health, 20.09.2020 23:01


