
Mathematics, 07.12.2019 02:31 zoewilliamss26
The following data is looking at how long it takes to get to work. let x = commuting distance (miles) and y = commuting time (minutes) x 15 16 17 18 19 20 y 42 35 45 42 49 46
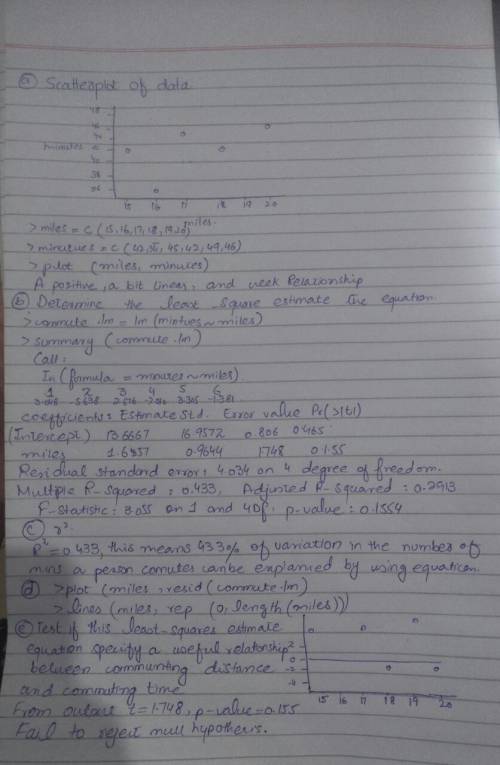
a. give a scatterplot of this data and comment on the direction, form and strength of this relationship.
b. determine the least-squares estimate equation for this data set.
c. give the r2, comment on what that means.
d. give the residual plot based on the least-squares estimate equation.
e. test if this least-squares estimate equation specify a useful relationship between commuting distance and commuting time.

Answers: 2
Another question on Mathematics
Mathematics, 21.06.2019 21:30
How do your peer relationships affect your overall health status? what can you do to improve your peer relationships?
Answers: 1
Mathematics, 22.06.2019 03:10
(co 3) the times that customers spend in a book store are normally distributed with a mean of 39.5 minutes and a standard deviation of 9.4 minutes. a random sample of 25 customers has a mean of 36.1 minutes or less. would this outcome be considered unusual, so that the store should reconsider its displays? no, the probability of this outcome at 0.035, would be considered usual, so there is no problem yes, the probability of this outcome at 0.035, would be considered unusual, so the display should be redone no the probability of this outcome at 0.359 would be considered usual, so there is no problem yes, the probability of this outcome at 0.965 would be considered unusual, so the display should be redone
Answers: 1
Mathematics, 22.06.2019 03:10
Suppose that a customer is purchasing a car. he conducts an experiment in which he puts 10 gallons of gas in the car and drives it until it runs out of gas. he conducts this experiment 15 times on each car and records the number of miles driven. full data set car 1 238238 216216 205205 212212 240240 274274 297297 252252 260260 247247 257257 243243 296296 243243 290290 car 2 245245 204204 215215 209209 251251 165165 221221 295295 172172 287287 268268 305305 320320 260260 297297 describe each data set, that is determine the shape, center, and spread. sample mean for car 1 x overbar equalsx=216216 mi / 10 gal (type an integer or decimal rounded to one decimal place as needed.) sample mean for car 2 x overbar equalsx=209209 mi / 10 gal (type an integer or decimal rounded to one decimal place as needed.)
Answers: 1
You know the right answer?
The following data is looking at how long it takes to get to work. let x = commuting distance (miles...
Questions

History, 18.02.2021 20:00

Mathematics, 18.02.2021 20:00


History, 18.02.2021 20:00
Mathematics, 18.02.2021 20:00
Social Studies, 18.02.2021 20:00
Biology, 18.02.2021 20:00
Chemistry, 18.02.2021 20:00


