
Mathematics, 10.12.2019 01:31 ramentome7542
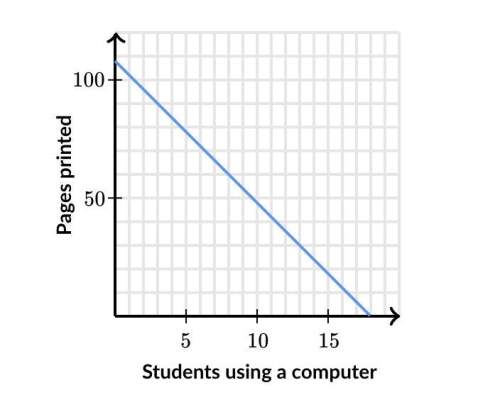
Students have a choice between taking a test on paper or on the computer. mrs. gazi graphed the relationship between the number of students taking the test on the computer and the number of test pages she would need to print.
(graph below)
what feature of the graph represents how many pages mrs. gazi would need to print if none of the students take the test on the computer?
a) slope
b) x-intercept
c) y-intercept
d) none of the above

Answers: 2
Another question on Mathematics
Mathematics, 21.06.2019 19:00
Give me the equations of two lines that have the same slope but are not parallel.
Answers: 3
Mathematics, 21.06.2019 20:30
Adecibel is a logarithmic unit that can be used to measure the intensity of a sound. the function y = 10logx gives the intensity of a sound in decibels, where x is the ratio of the intensity of the sound to a reference intensity. the reference intensity is generally set at the threshold of hearing. use the graphing utility to graph the decibel function.a whisper has a sound intensity of 30 decibels. use your graph to you complete the following statement. the sound intensity of a whisper is times the reference intensity.
Answers: 1
Mathematics, 21.06.2019 21:50
Question 14 (1 point) larry deposits $15 a week into a savings account. his balance in his savings account grows by a constant percent rate.
Answers: 3
You know the right answer?
Students have a choice between taking a test on paper or on the computer. mrs. gazi graphed the rela...
Questions

Geography, 26.06.2019 06:30


Social Studies, 26.06.2019 06:30


Biology, 26.06.2019 06:30
Biology, 26.06.2019 06:30
Biology, 26.06.2019 06:30

Biology, 26.06.2019 06:30


