Mathematics, 10.12.2019 03:31 mimireds5419
The scores for the local high school basketball teams from games played last week are shown in the table below.
43 58 55 67 6 51 68 36 60
42 57 62 39 50 36 40 60 53
which data display(s) can be used to find the interquartile range for the scores of the teams?
i. histogram
ii. dot plot
iii. box plot
i, ii, and iii
i and ii
ii and iii
iii only

Answers: 2
Another question on Mathematics

Mathematics, 21.06.2019 21:30
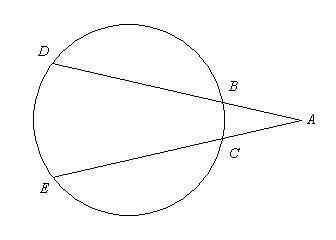
Are the corresponding angles congruent? explain why or why not.
Answers: 2

Mathematics, 21.06.2019 23:30
If you measured the width of a window in inches and then in feet with measurement would you have the greater number of units
Answers: 3

Mathematics, 22.06.2019 01:00
What are the solutions for the following system? -2x^2+y=-5 y=-3x^2+5
Answers: 3

Mathematics, 22.06.2019 02:30
Maria heard on the radio that the high temperature that day would be to determine the temperature in degrees celsius, she used the formula , where c is the temperature in degrees celsius and f is the temperature in degrees fahrenheit.
Answers: 1
You know the right answer?
The scores for the local high school basketball teams from games played last week are shown in the t...
Questions


History, 18.01.2021 17:50


Chemistry, 18.01.2021 17:50

Chemistry, 18.01.2021 17:50


Mathematics, 18.01.2021 17:50


Mathematics, 18.01.2021 18:00


