
Mathematics, 10.12.2019 21:31 Bamaboy8804
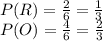
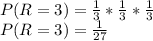
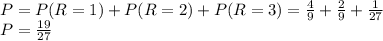
Two faces of a six-sided die are painted red, two are painted blue, and two are painted yellow. the die is rolled three times, and the colors that appear face up on the first, second, and third rolls are recorded.
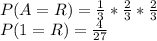
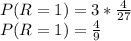
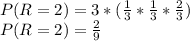
(a) find the probability of the event that exactly one of the colors that appears face up is red.
(b) find the probability of the event that at least one of the colors that appears face up is red.

Answers: 3
Another question on Mathematics
Mathematics, 21.06.2019 14:00
Jackie bought a bag of oranges. she used 3/8 of the oranges to make orange juice. she used 1/3 of the oranges to make a fruit salad. she put 1/8 of the oranges in a bowl on the table. she put 2/12 of the oranges in the refrigerator. a) jackie left more oranges on the table than she put in the refrigerator. b) jackie used fewer oranges to make orange juice than she left on the table. c) jackie put fewer oranges in the refrigerator than she used to make the fruit salad. eliminate d) jackie used more oranges to make a fruit salad than she used to make orange juice.
Answers: 1
Mathematics, 21.06.2019 16:00
Part one: measurements 1. measure your own height and arm span (from finger-tip to finger-tip) in inches. you will likely need some from a parent, guardian, or sibling to get accurate measurements. record your measurements on the "data record" document. use the "data record" to you complete part two of this project. name relationship to student x height in inches y arm span in inches archie dad 72 72 ginelle mom 65 66 sarah sister 64 65 meleah sister 66 3/4 67 rachel sister 53 1/2 53 emily auntie 66 1/2 66 hannah myself 66 1/2 69 part two: representation of data with plots 1. using graphing software of your choice, create a scatter plot of your data. predict the line of best fit, and sketch it on your graph. part three: the line of best fit include your scatter plot and the answers to the following questions in your word processing document 1. 1. which variable did you plot on the x-axis, and which variable did you plot on the y-axis? explain why you assigned the variables in that way. 2. write the equation of the line of best fit using the slope-intercept formula $y = mx + b$. show all your work, including the points used to determine the slope and how the equation was determined. 3. what does the slope of the line represent within the context of your graph? what does the y-intercept represent? 5. use the line of best fit to you to describe the data correlation.
Answers: 2
Mathematics, 21.06.2019 19:20
Which letters from the table represent like terms? a and b b and c a and d b and d
Answers: 3
Mathematics, 21.06.2019 20:30
Kyle and elijah are planning a road trip to california. their car travels 3/4 of a mile per min. if they did not stop driving, how many miles could kyle and elijah drove in a whole day? ? 1 day = 24 hours. plzzz write a proportion i will give you 100 points
Answers: 1
You know the right answer?
Two faces of a six-sided die are painted red, two are painted blue, and two are painted yellow. the...
Questions

Mathematics, 28.10.2020 06:40
Mathematics, 28.10.2020 06:40
Mathematics, 28.10.2020 06:40


History, 28.10.2020 06:40
Mathematics, 28.10.2020 06:40
Mathematics, 28.10.2020 06:40
Physics, 28.10.2020 06:40
History, 28.10.2020 06:40
Mathematics, 28.10.2020 06:40

Computers and Technology, 28.10.2020 06:40
Physics, 28.10.2020 06:40
History, 28.10.2020 06:40
Mathematics, 28.10.2020 06:40
Mathematics, 28.10.2020 06:40


