Questions with images:
2. the nonstandard distribution curve in the figure has a mean o...

Mathematics, 12.12.2019 22:31 saamiahs
Questions with images:
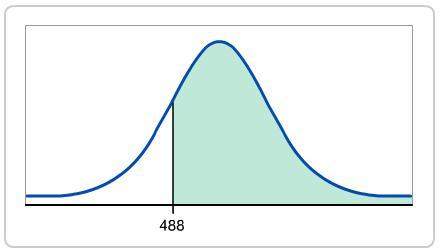
2. the nonstandard distribution curve in the figure has a mean of 553 and a standard deviation of 67. find the area of the shaded region.
-0.97
1.89
0.1660
0.8340
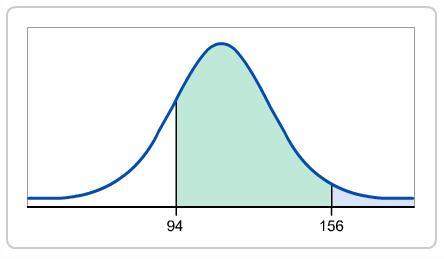
3. the data values in the normal distribution curve have of 112 with a standard deviation of 19.2. find the area of the shaded region.
0.8154
1.3500
0.1626
0.1846
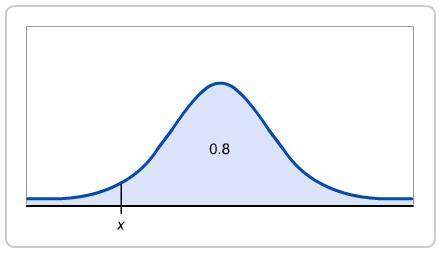
6. the figure shows a normal distribution curve with a mean of 3.47 and a standard deviation of 0.81. find the value of x, given that 80% of the values are greater than x.
5.13
2.79
1.95
2.06
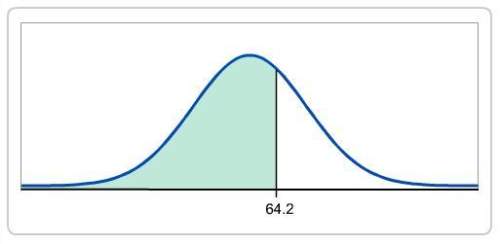
9. the graph shows a nonstandard normal distribution curve with a mean of 59.0 and a standard deviation of 6.7. find the area of the shaded region.
0.2177
0.7823
0.7761
0.3650
questions without images:
4. several science students used the same design when constructing a bridge out of balsa wood. they each tested the bridge's weight capacity using cups filled with sand. the weight capacities were recorded, and the results follow a normal distribution curve. the mean of the weights is 19.6 lb with a standard deviation of 1.3 lb. which weight is greater than 70% of the data?
19.99lb
20.51lb
18.92lb
20.29lb
5. a given set of values is found to be a normal distribution with a mean of 140 and a standard deviation of 18.0. find the value that is greater than 45% of the data values.
149.9
148.1
137.8
142.3
7. the scores of first-time players of a popular video game are recorded. the results follow a normal distribution curve. the results follow a normal distribution curve. the mean is 12388 points with a standard deviation of 953 points. what is the probability that a randomly selected player's score is more than 11950 points?
0.6772
0.3228
-0.46
0.1550
8. a set of data following a normal distribution has a mean of 192.3 and a standard deviation of 11.8. find the probability that a randomly selected value is less than 212.5.
0.0168
0.0436
0.5827
0.9564
10. a recent botany experiment showed a variety of results for the height of certain plants. the results followed a normal distribution with a mean of 8.4 feet and a standard deviation of 2.2 feet. find the probability that a randomly selected plant with have a height less than 6.0 feet.
0.9621
0.7257
0.1379
0.9861

Answers: 2
Another question on Mathematics
Mathematics, 21.06.2019 14:00
Acompany is testing in comparing to lightbulb designs the box plot shows the number of hours that each lightbulb design last before burning out which statement is best supported by the information of the plot
Answers: 3
Mathematics, 21.06.2019 16:30
The table above shows approximate conversions from gallons to liters. what is the value of x?
Answers: 2
Mathematics, 21.06.2019 16:30
Problem melissa is her dad build a walkway in their backyard. the walkway will be 54 feet long and 1.5 feet wide. the local hardware store sells tiles which are 1.5 by 1.5 feet and come in boxes of 12. how many boxes of tiles do they need?
Answers: 1
You know the right answer?
Questions

Mathematics, 19.02.2021 01:50
SAT, 19.02.2021 01:50

Health, 19.02.2021 01:50
Mathematics, 19.02.2021 01:50
Mathematics, 19.02.2021 01:50


SAT, 19.02.2021 01:50
Mathematics, 19.02.2021 01:50
Mathematics, 19.02.2021 01:50


