
Mathematics, 20.12.2019 03:31 major126
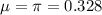
Astudy was conducted to investigate the relationship between maternal smoking during pregnancy and the presence of congenital malformations in the child. among children who suffer from an abnormality other than down's syndrome or an oral cleft, 32.8% have mothers who smoked during pregnancy. this proportion is homogeneous for children with various types of defects.
a) if you were to select repeated samples of size 25 from this population, what could you say about the distribution of the sample proportions? list 3 properties.
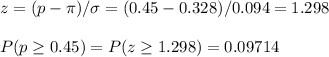
b) among the samples of size 25, what fraction has a sample proportion of .45 or higher?
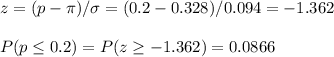
c) what fraction has a sample proportion of .20 or lower?
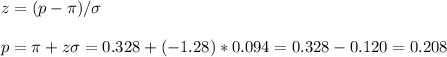
d) what value of p cuts off the lower 10% of the distribution?

Answers: 2

Another question on Mathematics
Mathematics, 21.06.2019 16:00
If the measure of angle 1 is 110 degrees and the measure of angle 3 is (2 x+10 degree), what is the value of x?
Answers: 2
Mathematics, 21.06.2019 16:00
Part one: measurements 1. measure your own height and arm span (from finger-tip to finger-tip) in inches. you will likely need some from a parent, guardian, or sibling to get accurate measurements. record your measurements on the "data record" document. use the "data record" to you complete part two of this project. name relationship to student x height in inches y arm span in inches archie dad 72 72 ginelle mom 65 66 sarah sister 64 65 meleah sister 66 3/4 67 rachel sister 53 1/2 53 emily auntie 66 1/2 66 hannah myself 66 1/2 69 part two: representation of data with plots 1. using graphing software of your choice, create a scatter plot of your data. predict the line of best fit, and sketch it on your graph. part three: the line of best fit include your scatter plot and the answers to the following questions in your word processing document 1. 1. which variable did you plot on the x-axis, and which variable did you plot on the y-axis? explain why you assigned the variables in that way. 2. write the equation of the line of best fit using the slope-intercept formula $y = mx + b$. show all your work, including the points used to determine the slope and how the equation was determined. 3. what does the slope of the line represent within the context of your graph? what does the y-intercept represent? 5. use the line of best fit to you to describe the data correlation.
Answers: 2
Mathematics, 21.06.2019 19:30
You deposit $5000 each year into an account earning 3% interest compounded annually. how much will you have in the account in 30 years?
Answers: 3
Mathematics, 21.06.2019 19:40
The owners of four companies competing for a contract are shown in the table below. if a report is released that advocates company b, which of the people having funded the report should result in the most skepticism? company owner of company company a jake adams company b company c company d debby smith henry rose rhonda baker o a. jake adams o b. rhonda baker o c. debby smith o d. henry rose
Answers: 2
You know the right answer?
Astudy was conducted to investigate the relationship between maternal smoking during pregnancy and t...
Questions

Health, 16.10.2020 22:01
Mathematics, 16.10.2020 22:01
Mathematics, 16.10.2020 22:01

Computers and Technology, 16.10.2020 22:01
Computers and Technology, 16.10.2020 22:01
Mathematics, 16.10.2020 22:01

Mathematics, 16.10.2020 22:01
Mathematics, 16.10.2020 22:01

Biology, 16.10.2020 22:01

Mathematics, 16.10.2020 22:01

Physics, 16.10.2020 22:01


Advanced Placement (AP), 16.10.2020 22:01

Spanish, 16.10.2020 22:01


