
Mathematics, 24.12.2019 01:31 DaFuzzyDude
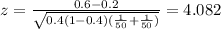
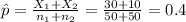
Let n1equals50, upper x 1equals30, n2equals50, and upper x 2equals10. complete parts (a) and (b) below. a. at the 0.05 level of significance, is there evidence of a significant difference between the two population proportions? determine the null and alternative hypotheses. choose the correct answer below. a. upper h 0 : pi 1 equals pi 2 upper h 1 : pi 1 not equals pi 2 your answer is correct. b. upper h 0 : pi 1 greater than or equals pi 2 upper h 1 : pi 1 less than pi 2 c. upper h 0 : pi 1 less than or equals pi 2 upper h 1 : pi 1 greater than pi 2 d. upper h 0 : pi 1 not equals pi 2 upper h 1 : pi 1 equals pi 2 calculate the test statistic, upper z subscript stat, based on the difference p1minusp2.

Answers: 2


 always
  so we can conclude that we have enough evidence to reject the null hypothesis, and we can say the the proportion 1 is significantly different from proportion 2.
  represent the number of people with a characteristic in 1
 represent the number of people with a characteristic in 2
 sample of 1 selected
  sample of 2 selected
  represent the proportion of people with a characteristic in 1
 represent the proportion of people with a characteristic in 2
 represent the value for the test (variable of interest)
 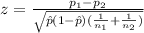 (1)
(1) 
 , but we can calculate the p value for this test.
 Another question on Mathematics
Mathematics, 21.06.2019 15:00
Find the length of the following tangent segments to the circles centered at o and o' whose radii are 5 and 3 respectively and the distance between o and o' is 12. what is the tangent segment of cd?
Answers: 1
Mathematics, 21.06.2019 20:00
Find the value of x. give reasons to justify your solutions! l, m ∈ kn
Answers: 3
Mathematics, 22.06.2019 03:00
Describe how the presence of possible outliers might be identified on the following. (a) histograms gap between the first bar and the rest of bars or between the last bar and the rest of bars large group of bars to the left or right of a gap higher center bar than surrounding bars gap around the center of the histogram higher far left or right bar than surrounding bars (b) dotplots large gap around the center of the data large gap between data on the far left side or the far right side and the rest of the data large groups of data to the left or right of a gap large group of data in the center of the dotplot large group of data on the left or right of the dotplot (c) stem-and-leaf displays several empty stems in the center of the stem-and-leaf display large group of data in stems on one of the far sides of the stem-and-leaf display large group of data near a gap several empty stems after stem including the lowest values or before stem including the highest values large group of data in the center stems (d) box-and-whisker plots data within the fences placed at q1 â’ 1.5(iqr) and at q3 + 1.5(iqr) data beyond the fences placed at q1 â’ 2(iqr) and at q3 + 2(iqr) data within the fences placed at q1 â’ 2(iqr) and at q3 + 2(iqr) data beyond the fences placed at q1 â’ 1.5(iqr) and at q3 + 1.5(iqr) data beyond the fences placed at q1 â’ 1(iqr) and at q3 + 1(iqr)
Answers: 1
You know the right answer?
Let n1equals50, upper x 1equals30, n2equals50, and upper x 2equals10. complete parts (a) and (b) bel...
Questions

Physics, 08.05.2021 08:50
Mathematics, 08.05.2021 08:50

Spanish, 08.05.2021 08:50

History, 08.05.2021 08:50
Mathematics, 08.05.2021 08:50
Mathematics, 08.05.2021 08:50

Mathematics, 08.05.2021 08:50

Mathematics, 08.05.2021 08:50

Social Studies, 08.05.2021 08:50
Mathematics, 08.05.2021 08:50

Biology, 08.05.2021 08:50
History, 08.05.2021 08:50
Mathematics, 08.05.2021 08:50


