
Mathematics, 28.12.2019 01:31 haileyhale5
The fish and game department stocked a lake with fish in the following proportions: 30% catfish, 15% bass, 40% bluegill, and 15% pike. five years later it sampled the lake to see if the distribution of fish had changed. it found that the 500 fish in the sample were distributed as follows.
catfish, bass, bluegill, pike
112, 95, 210, 83
in the 5-year interval, did the distribution of fish change at the 0.05 level?
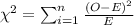
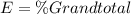
1. find the value of the chi-square statistic for the sample. (round the expected frequencies to at least three decimal places. round the test statistic to three decimal places.)
2. find or estimate the p- value of sample test statistic?

Answers: 3


 and we can find the critical value with the following excel code: "=CHISQ.INV(0.95,3)", and our critical value would be
Another question on Mathematics
Mathematics, 21.06.2019 18:40
Ten times the square of a non-zero number is eqaul to ninety times the number
Answers: 1
Mathematics, 21.06.2019 20:00
Given the graphed function below which of the following orders pairs are found on the inverse function
Answers: 1
Mathematics, 21.06.2019 20:30
The graph of a hyperbola is shown. what are the coordinates of a vertex of the hyperbola? (0, −4) (−3, 0) (0, 0) (0, 5)
Answers: 1
You know the right answer?
The fish and game department stocked a lake with fish in the following proportions: 30% catfish, 15...
Questions

Arts, 25.10.2021 08:50
Mathematics, 25.10.2021 08:50

English, 25.10.2021 08:50

Social Studies, 25.10.2021 08:50
English, 25.10.2021 08:50

Mathematics, 25.10.2021 08:50

Mathematics, 25.10.2021 08:50
English, 25.10.2021 08:50

Biology, 25.10.2021 08:50
Mathematics, 25.10.2021 08:50
Biology, 25.10.2021 08:50
Mathematics, 25.10.2021 08:50
Mathematics, 25.10.2021 08:50
Mathematics, 25.10.2021 08:50

Geography, 25.10.2021 08:50


