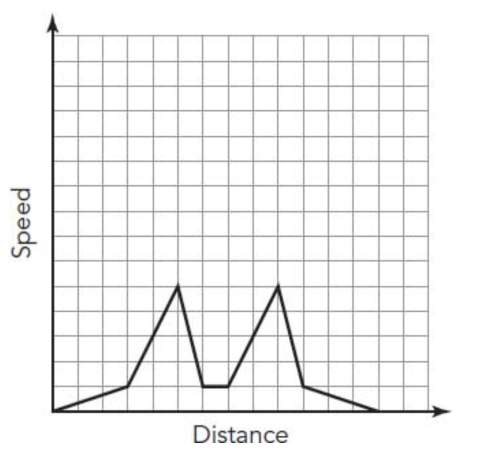
Which story could be represented by the graph shown?
a.
miriam walked to her...

Mathematics, 30.12.2019 04:31 dean91
Which story could be represented by the graph shown?
a.
miriam walked to her friend’s house, walked home, walked to the store, and walked home again.
b.
miriam bicycled up and down two hills in her neighborhood.
c.
miriam jogged, then did two circuits of running fast and slowing down, and finally jogged to a stop.
d.
miriam swam two laps at the swimming pool at a constant speed before resting.

Answers: 1
Another question on Mathematics
Mathematics, 21.06.2019 16:00
Asap for seven months an ice creams vendor collects data showing the number of cones sold a day (c) and the degrees above 70 degrees f the vendor finds that there is a positive linear association between c and t that is the best modeled by this equation c=3.7t+98 which statement is true? the model predicts that the average number of cones sold in a day is 3.7 the model predicts that the average number of cones sold i a day is 98 a model predicts that for each additional degree that the high temperature is above 70 degres f the total of number of cones sold increases by 3.7 the model predicts for each additional degree that the high temperature is above 70 degrees f the total number of cones sold increasingly by 98
Answers: 3
Mathematics, 21.06.2019 16:00
Josephine has a great garden with and area of 2x2 + x - 6 square feet
Answers: 2
Mathematics, 21.06.2019 18:20
What is the y-intercept of the line given by the equation
Answers: 2
Mathematics, 21.06.2019 19:50
Drag each tile into the correct box. not all tiles will be used. find the tables with unit rates greater than the unit rate in the graph. then tenge these tables in order from least to greatest unit rate
Answers: 2
You know the right answer?
Questions


Mathematics, 26.02.2020 03:15
Mathematics, 26.02.2020 03:15

Mathematics, 26.02.2020 03:15
Mathematics, 26.02.2020 03:15

Chemistry, 26.02.2020 03:15
Mathematics, 26.02.2020 03:15
Mathematics, 26.02.2020 03:15


