

x, y

Mathematics, 31.12.2019 05:31 blazecarley
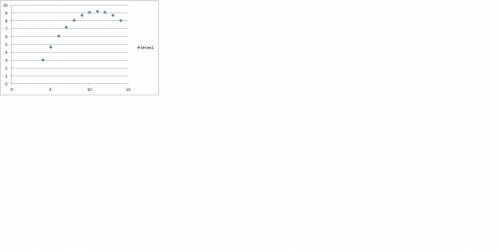
Use the given data set to complete parts (a) through (c) below. (use a = 0.05.)
x, y
10,9.14
8,8.15
13,8.75
9,8.77
11,9.25
14,8.09
6,6.13
4,3.09
12,9.14
7,7.25
5,4.73
a - construct a scatterplot.
b - find the linear correlation coefficient, r, then determine whether there is sufficient evidence to support the claim of a linear correlation between the two variables.
the linear correlation coefficient is r =
determine whether there is sufficient evidence to support the claim of a linear correlation between the two variables. choose the correct answer below.
a- there is sufficient evidence to support the claim of a linear correlation between the two variables.
b- there is insufficient evidence to support the claim of a linear correlation between the two variables.
c- there is insufficient evidence to support the claim of a nonlinear correlation between the two variables.
d- there is sufficient evidence to support the claim of a nonlinear correlation between the two variables.
c- identify the feature of the data that would be missed if part (b) was completed without constructing the scatterplot. choose the correct answer below.
a- the scatterplot reveals a distinct pattern that is astraight-line pattern with positive slope.
b- the scatterplot reveals a distinct pattern that is not astraight-line pattern.
c- the scatterplot reveals a distinct pattern that is astraight-line pattern with negative slope.
d- the scatterplot does not reveal a distinct pattern.

Answers: 1
Another question on Mathematics
Mathematics, 21.06.2019 20:10
Acolony contains 1500 bacteria. the population increases at a rate of 115% each hour. if x represents the number of hours elapsed, which function represents the scenario? f(x) = 1500(1.15)" f(x) = 1500(115) f(x) = 1500(2.15) f(x) = 1500(215)
Answers: 3
Mathematics, 21.06.2019 20:50
Amanda went into the grocery business starting with five stores. after one year, she opened two more stores. after two years, she opened two more stores than the previous year. if amanda expands her grocery business following the same pattern, which of the following graphs represents the number of stores she will own over time?
Answers: 3
Mathematics, 21.06.2019 23:00
1. an economy consists of three workers: larry, moe, and curly. each works 10 hours a day and can produce two services: mowing lawns and washing cars. in an hour, larry can either mow one lawn or wash one car; moe can either mow one lawn or wash two cars; and curly can either mow two lawns or wash one car. a. calculate how much of each service is produced under the following circumstances: a. all three spend all their time mowing lawns. b. all three spend all their time washing cars. c. all three spend half their time on each activity d. larry spends half of his time on each activity, while moe only washes cars and curly only mows lawns b. using your answers to part a, draw a production possibilities frontier and label points a, b, c, and d on your graph. explain why the production possibilities frontier has the shape it does. c. are any of the allocations calculated in part a inefficient? explain.
Answers: 3
You know the right answer?
Use the given data set to complete parts (a) through (c) below. (use a = 0.05.)
x, y
x, y
Questions

Spanish, 25.01.2020 00:31


Mathematics, 25.01.2020 00:31


