 .
. ,0)
,0)Mike and menna were instructed to graph the function y = 12 x + 1. their graphs are shown.
the...

Mathematics, 03.01.2020 23:31 ozzy1146
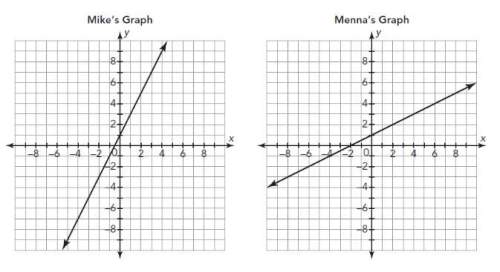
Mike and menna were instructed to graph the function y = 12 x + 1. their graphs are shown.
the figure shows two graphs in the xy-plane. the graph on the left is labeled as mike's graph. the values on the x-axis range from negative 8 to 8 in increments of 2 and the values on the y-axis range from negative 8 to 8 in increments of 2. a line is shown which intersects the x-axis at negative 0.5 and y-axis at 1. the graph on the right is labeled as menna's graph. the values on the x-axis range from negative 8 to 8 in increments of 2 and the values on the y-axis range from negative 8 to 8 in increments of 2. a line is shown which intersects the x-axis at 2 and y-axis at 1.
which student graphed the function correctly?
what mistake did the other student make?

Answers: 3
Another question on Mathematics
Mathematics, 21.06.2019 14:30
Me #1 using vocabulary words, including the word “congruent”, state why the measure of angle d is 120 degrees. #2 what is the measure of angle e and why?
Answers: 1
Mathematics, 21.06.2019 18:00
What is the relationship between all triangles that can be drawn given the same three angles
Answers: 2
Mathematics, 21.06.2019 20:00
Prove that the value of the expression 7^8–7^7+7^6 is divisible by 43.
Answers: 1
Mathematics, 21.06.2019 20:30
2. explain in words how you plot the point (4, −2) in a rectangular coordinate system.
Answers: 1
You know the right answer?
Questions

English, 15.04.2021 21:40

History, 15.04.2021 21:40


Spanish, 15.04.2021 21:40

Mathematics, 15.04.2021 21:40
Mathematics, 15.04.2021 21:40
Mathematics, 15.04.2021 21:40
English, 15.04.2021 21:40
Mathematics, 15.04.2021 21:40
English, 15.04.2021 21:40
English, 15.04.2021 21:40


Arts, 15.04.2021 21:40


