
Mathematics, 09.01.2020 00:31 hannahv10
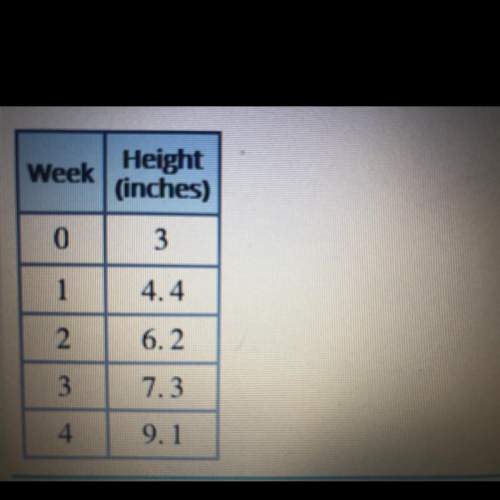
elle measured the height of a plant, in inches, every week for four weeks after planting it. the table shows her data.
look at the image for the data
the height of the plant, h , in inches , can be modeled by the function h (t) = 1.5t + 3, where team represents the time in weeks.
based on this model, what is the best prediction for the height of the plant after 12 weeks?
a 16.5 inches
b 21 inches
c 22.5 inches
d 27.3 inches
hurry !

Answers: 1
Another question on Mathematics
Mathematics, 21.06.2019 14:30
Ablock of wood is a cube whose side is x in. long. you cut off a 1-inch thick piece from the entire right side. then you cut off a 3-inch thick piece from the entire top of the remaining shape. the volume of the remaining block is 2,002 in3. what are the dimensions of the original block of wood?
Answers: 2
Mathematics, 21.06.2019 20:00
Solve each equation using the quadratic formula. find the exact solutions. 6n^2 + 4n - 11
Answers: 2
Mathematics, 21.06.2019 22:30
Sketch the vector field vector f( vector r ) = 8vector r in the xy-plane. select all that apply. the length of each vector is 8. the lengths of the vectors decrease as you move away from the origin. all the vectors point away from the origin. all the vectors point in the same direction. all the vectors point towards the origin. the lengths of the vectors increase as you move away from the origin.
Answers: 2
Mathematics, 21.06.2019 23:30
In a study of the relationship between socio-economic class and unethical behavior, 129 university of california undergraduates at berkeley were asked to identify themselves as having low or high social-class by comparing themselves to others with the most (least) money, most (least) education, and most (least) respected jobs. they were also presented with a jar of individually wrapped candies and informed that the candies were for children in a nearby laboratory, but that they could take some if they wanted. after completing some unrelated tasks, participants reported the number of candies they had taken. it was found that those who were identiď¬ed as upper-class took more candy than others. in this study, identify: (a) the cases, (b) the variables and their types, (c) the main research question, (d) identify the population of interest and the sample in this study, and (e) comment on whether or not the results of the study can be generalized to the population, and if the ď¬ndings of the study can be used to establish causal relationships.
Answers: 2
You know the right answer?
elle measured the height of a plant, in inches, every week for four weeks after planting it. the tab...
Questions
Mathematics, 17.03.2022 14:00


Computers and Technology, 17.03.2022 14:00

Spanish, 17.03.2022 14:00


History, 17.03.2022 14:00
Mathematics, 17.03.2022 14:00
Mathematics, 17.03.2022 14:00

Mathematics, 17.03.2022 14:00
Computers and Technology, 17.03.2022 14:00
History, 17.03.2022 14:00
Mathematics, 17.03.2022 14:00

English, 17.03.2022 14:00


