
Mathematics, 16.01.2020 05:31 haileyhale5
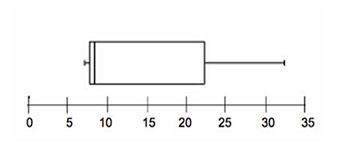
Given the box plot, will the mean or the median provide a better description of the center? (1 point)
box plot with min at 6, q1 at 7.5, median at 8, q3 at 23, max at 32.5
the median, because the data distribution is symmetrical
the median, because the data distribution is skewed to the right
the mean, because the data distribution is symmetrical
the mean, because the data distribution is skewed to the right

Answers: 1
Another question on Mathematics
Mathematics, 21.06.2019 14:10
which best describes the transformation from the graph of f(x) = x2 to the graph of f(x) = (x – 3)2 – 1? left 3 units, down 1 unitleft 3 units, up 1 unitright 3 units, down 1 unit right 3 units, up 1 unit
Answers: 1
Mathematics, 21.06.2019 23:00
According to the general equation for conditional probability if p(anb)=3/7 and p(b)=7/8 what is p(a i b)
Answers: 1
Mathematics, 21.06.2019 23:20
1. ∠1 is complementary to ∠2 and ∠3 is complementary to ∠2. subtraction property of equality 2. m∠1 + m∠2 = 90 and m∠3 + m∠2 = 90 substitution 3. m∠1 + m∠2 = m∠3 + m∠2 definition of complementary 4. m∠1 = m∠3 given
Answers: 3
Mathematics, 22.06.2019 00:00
Jessie and bob are financing $425,500 to purchase a house. they obtained a 30/8 balloon mortgage at 6.55%. what will their balloon payment be?
Answers: 3
You know the right answer?
Given the box plot, will the mean or the median provide a better description of the center? (1 poin...
Questions

Mathematics, 20.10.2020 02:01

Mathematics, 20.10.2020 02:01
Mathematics, 20.10.2020 02:01


Advanced Placement (AP), 20.10.2020 02:01

Physics, 20.10.2020 02:01
Mathematics, 20.10.2020 02:01

Chemistry, 20.10.2020 02:01
Mathematics, 20.10.2020 02:01

Social Studies, 20.10.2020 02:01
Mathematics, 20.10.2020 02:01


