
Mathematics, 17.01.2020 22:31 oliviac0327
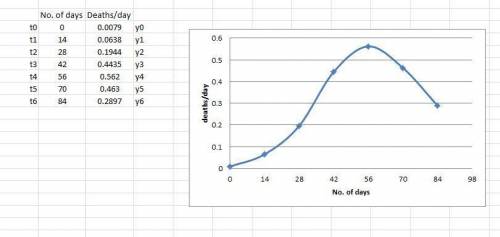
The table shows the number of people per day who died from sars in singapore at two-week intervals beginning on march 1, 2003.
date deaths per day date deaths per day
march 1 0.0079 april 26 0.5620
march 15 0.0638 may 10 0.4630
march 29 0.1944 may 24 0.2897
april 12 0.4435
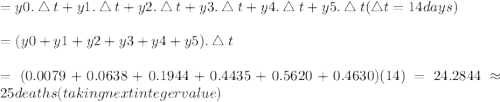
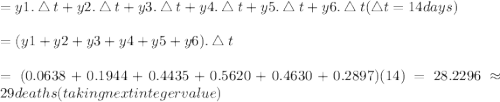
(a) by using an argument similar to that in the example, estimate the number of people who died of sars in singapore between march 1 and may 24, 2003, using both left endpoints and right endpoints. (round your answers to the nearest whole number.)
left endpoint people
right endpoint people
(b) how would you interpret the number of sars deaths as an area under a curve?

Answers: 2
Another question on Mathematics
Mathematics, 21.06.2019 14:30
Which functions are even? check all of the boxes that apply. f(x) = x4 – x? f(x) = x2 – 3x + 2 f(x) = (x - 2) f(x) = x done
Answers: 3
Mathematics, 21.06.2019 16:30
What is the fewest number of full weeks briyana would have to work to have enough money? 8 weeks9 weeks 10 weeks11 weeks
Answers: 1
Mathematics, 21.06.2019 19:00
Rena is building a 1: 180 scale model of a real castle. her model has a rectangular base that is 3 feet wide and 4 feet long what is the area of the base of the actual castle in square feet
Answers: 2
Mathematics, 21.06.2019 19:00
What are the solutions of the system? solve by graphing. y = -x^2 - 3x + 2 y = -2x + 2
Answers: 1
You know the right answer?
The table shows the number of people per day who died from sars in singapore at two-week intervals b...
Questions
Mathematics, 02.09.2019 04:10

Biology, 02.09.2019 04:10

English, 02.09.2019 04:10


Social Studies, 02.09.2019 04:10


Mathematics, 02.09.2019 04:10


History, 02.09.2019 04:10
Biology, 02.09.2019 04:10
Mathematics, 02.09.2019 04:10
Mathematics, 02.09.2019 04:10
Social Studies, 02.09.2019 04:10
Mathematics, 02.09.2019 04:10
Mathematics, 02.09.2019 04:10


