Mathematics, 21.01.2020 23:31 yorblayo17011
In part a, you calculated ratios with the of geogebra. now you'll use the distance formula to calculate more ratios. choose two line segments in the logo that are not horizontal or vertical. for n = 3, calculate the lengths of the line segments in the image and in the preimage using the distance formula . when you’re through, find the ratio of the segment length in the image to the corresponding segment length in the preimage. how do your ratios compare to the scale factor n = 3? show your work


Answers: 1
Another question on Mathematics

Mathematics, 20.06.2019 18:02
10 pointsthe roof of a house has a slope of 5/12. what is the width of the house if the height of the roof is 8 feet?
Answers: 1

Mathematics, 21.06.2019 14:10
You invested $5000 between two accounts paying 4% and 9% annual interest, respectively. if the total interest earned for theyear was $350, how much was invested at each rate? $was invested at 4% andwas invested at 9%.
Answers: 3

Mathematics, 21.06.2019 19:50
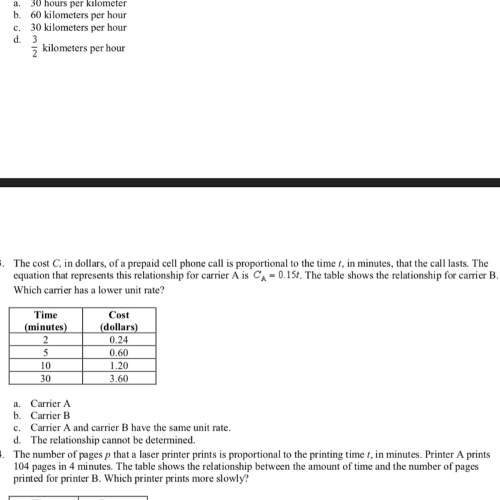
Drag each tile into the correct box. not all tiles will be used. find the tables with unit rates greater than the unit rate in the graph. then tenge these tables in order from least to greatest unit rate
Answers: 2

Mathematics, 21.06.2019 21:30
Name and describe the three most important measures of central tendency. choose the correct answer below. a. the mean, sample size, and mode are the most important measures of central tendency. the mean of a data set is the sum of the observations divided by the middle value in its ordered list. the sample size of a data set is the number of observations. the mode of a data set is its highest value in its ordered list. b. the sample size, median, and mode are the most important measures of central tendency. the sample size of a data set is the difference between the highest value and lowest value in its ordered list. the median of a data set is its most frequently occurring value. the mode of a data set is sum of the observations divided by the number of observations. c. the mean, median, and mode are the most important measures of central tendency. the mean of a data set is the product of the observations divided by the number of observations. the median of a data set is the lowest value in its ordered list. the mode of a data set is its least frequently occurring value. d. the mean, median, and mode are the most important measures of central tendency. the mean of a data set is its arithmetic average. the median of a data set is the middle value in its ordered list. the mode of a data set is its most frequently occurring value.
Answers: 3
You know the right answer?
In part a, you calculated ratios with the of geogebra. now you'll use the distance formula to calcu...
Questions

Mathematics, 10.03.2021 01:50


Mathematics, 10.03.2021 01:50


Mathematics, 10.03.2021 01:50


Mathematics, 10.03.2021 01:50


English, 10.03.2021 01:50


Mathematics, 10.03.2021 01:50


Mathematics, 10.03.2021 01:50


Health, 10.03.2021 01:50


