
Mathematics, 27.01.2020 12:31 sloane50
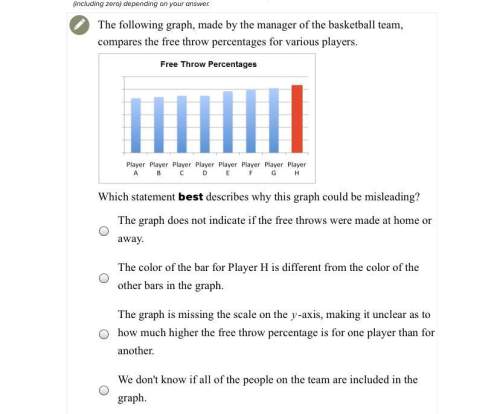
The following graph, made by the manager of the basketball team, compares the free throw percentages for various players.
which statement best describes why this graph could be misleading?
a. the graph does not indicate if the free throws were made at home or away.
b. the color of the bar for player h is different from the color of the other bars in the graph.
c. the graph is missing the scale on the y-axis, making it unclear as to how much higher the free throw percentage is for one player than for another.
d. we don't know if all of the people on the team are included in the graph.

Answers: 3
Another question on Mathematics
Mathematics, 21.06.2019 14:30
Match the following terms with their definitions. 1. bisector of a segment ray ba and ray bc are opposite rays if a, b, and c are collinear and b (the endpoint of both rays) is between a and c. 2. opposite rays a ray, , is the set of points beginning at point a and going infinitely in the direction of point b. 3. collinear points a line or segment that intersects the segment at its midpoint. 4. betweenness of points a set of two or more points all on the same line. 5. ray the distance between the endpoints of a segment. 6. space point b is between a and c if a, b, and c are collinear and the equation ab + bc = ac is true, where ab, bc, and ac are the distances between points a and b, b and c, and a and c, respectively. 7. midpoint of a segment a set of two or more points all on the same plane. 8. coplanar points the point on a segment that divides the segment into two equal segments. 9. length of a segment the set of all possible points. 10. line segment the set of two different endpoints and all points between them.
Answers: 1
Mathematics, 21.06.2019 18:30
The height of a flare fired from the deck of a ship in distress can be modeled by h(t)= -2(8t^2-52t-28), where h is the height of the flare above water and t is the time in seconds. a. find the time it takes the flare to hit the water.
Answers: 1
Mathematics, 21.06.2019 19:00
Which graph represents the parent function of y=(x+2)(x-2)
Answers: 1
Mathematics, 21.06.2019 20:30
Asmall business produces and sells balls. the fixed costs are $20 and each ball costs $4.32 to produce. each ball sells for $8.32. write the equations for the total cost, c, and the revenue, r, then use the graphing method to determine how many balls must be sold to break even.
Answers: 1
You know the right answer?
The following graph, made by the manager of the basketball team, compares the free throw percentages...
Questions


Chemistry, 12.12.2019 19:31

Spanish, 12.12.2019 19:31
Mathematics, 12.12.2019 19:31


English, 12.12.2019 19:31


History, 12.12.2019 19:31
Mathematics, 12.12.2019 19:31


