
Mathematics, 18.02.2020 18:53 djennings8055
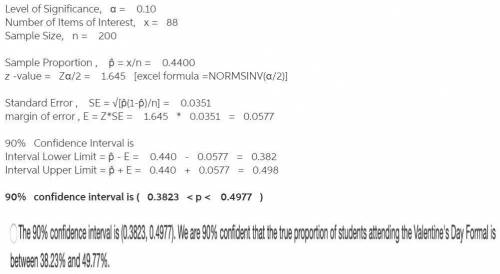
Faculty members at Lowell Place High School want to determine whether there are enough students to have a Valentine's Day Formal. Eighty-eight of the 200 students said they would attend the Valentine's Day Formal. Construct and interpret a 90% confidence interval for p.
The 90% confidence interval is (0.4977, 0.5023). We are 90% confident that the true proportion of students attending the Valentine's Day Formal is between 49.77% and 50.23%.
The 90% confidence interval is (0.3823, 0.4977). There is a 90% chance that a randomly selected student who will attend the Valentine's Day Formal lies between 38.23% and 49.77%.
The 90% confidence interval is (0.4977, 0.5023). Ninety percent of all samples of this size will yield a confidence interval of (0.4977, 0.5023).
The 90% confidence interval is (0.3823, 0.4977). Ninety percent of all samples of this size will yield a confidence interval of (0.3823, 0.4977).
The 90% confidence interval is (0.3823, 0.4977). We are 90% confident that the true proportion of students attending the Valentine's Day Formal is between 38.23% and 49.77%.

Answers: 1
Another question on Mathematics
Mathematics, 21.06.2019 16:30
Amuffin recipe, which yields 12 muffins, calls for cup of milk for every 1 cups of flour. the same recipe calls for cup of coconut for every cup of chopped apple. to yield a batch of 30 muffins, how much flour will be needed in the mix?
Answers: 1
Mathematics, 21.06.2019 21:30
Consider a bag that contains 220 coins of which 6 are rare indian pennies. for the given pair of events a and b, complete parts (a) and (b) below. a: when one of the 220 coins is randomly selected, it is one of the 6 indian pennies. b: when another one of the 220 coins is randomly selected (with replacement), it is also one of the 6 indian pennies. a. determine whether events a and b are independent or dependent. b. find p(a and b), the probability that events a and b both occur.
Answers: 2
Mathematics, 21.06.2019 21:30
Create a graph for the demand for starfish using the following data table: quantity/price of starfish quantity (x axis) of starfish in dozens price (y axis) of starfish per dozen 0 8 2 6 3 5 5 2 7 1 9 0 is the relationship between the price of starfish and the quantity demanded inverse or direct? why? how many dozens of starfish are demanded at a price of five? calculate the slope of the line between the prices of 6 (quantity of 2) and 1 (quantity of 7) per dozen. describe the line when there is a direct relationship between price and quantity.
Answers: 3
You know the right answer?
Faculty members at Lowell Place High School want to determine whether there are enough students to h...
Questions


Mathematics, 05.01.2021 20:10
Mathematics, 05.01.2021 20:10

Mathematics, 05.01.2021 20:10
Mathematics, 05.01.2021 20:10
Mathematics, 05.01.2021 20:10
Mathematics, 05.01.2021 20:10
History, 05.01.2021 20:10
History, 05.01.2021 20:10
History, 05.01.2021 20:10


