
Mathematics, 20.02.2020 04:52 briannalv0814
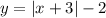
The graph of y = StartAbsoluteValue x EndAbsoluteValue is transformed as shown in the graph below. Which equation represents the transformed function?
On a coordinate plane, an absolute value function is shown. The vertex of the function is at (negative 3, negative 2). It crosses the x-axis at (negative 5, 0) and (negative 1, 0) and it crosses the y-axis at (0, 1).
y = StartAbsoluteValue x minus 3 EndAbsoluteValue + 2
y = StartAbsoluteValue x + 3 EndAbsoluteValue minus 2
y = StartAbsoluteValue x minus 2 EndAbsoluteValue + 3
y = StartAbsoluteValue x + 2 EndAbsoluteValue minus 3

Answers: 2
 g(-5) = |-5 + 3} - 2 = 2 - 2 = 0 ⇒ (-5,0)
 Another question on Mathematics
Mathematics, 21.06.2019 15:00
What are the constants in this expression? -10.6+9/10+2/5m-2.4n+3m
Answers: 3
Mathematics, 21.06.2019 15:30
Jonah runs 3/5 miles on sunday and 7/10 mile on monday. he uses the model to find that he can ran a total of 1 mile . what mistake does jonah make
Answers: 2
Mathematics, 22.06.2019 00:30
A10 inch cookie cake is divided into 8 slices. what is the area of 3 slices
Answers: 1
You know the right answer?
The graph of y = StartAbsoluteValue x EndAbsoluteValue is transformed as shown in the graph below. W...
Questions


Computers and Technology, 13.11.2020 04:10
Mathematics, 13.11.2020 04:10

Biology, 13.11.2020 04:10

English, 13.11.2020 04:10

History, 13.11.2020 04:10

Social Studies, 13.11.2020 04:10
Mathematics, 13.11.2020 04:10
History, 13.11.2020 04:10
English, 13.11.2020 04:10
History, 13.11.2020 04:10
History, 13.11.2020 04:10
English, 13.11.2020 04:10


