Hello!
Data set:
Age X₁: 20; 30; 35; 25; 55; 60; 75; 15; 50; 40
Systolic pressure X₂: 115; 140; 125; 110; 140; 135; 145; 120; 140; 120
a.
Auxiliary calculations:
∑X₁= 405
∑X₁²= 19725
∑X₂= 1290
∑X₂²= 167800
∑X₁X₂= 53900
Mean (X[bar]).
The mean is a measure of central tendency, it takes a value within the definition range of the variable but it does not necessarily coincide with one of the observations. It shows you what the expected value of the variable is.
To calculate the mean of a data set you have to add all observations and divide it by the sample size.
X[bar]₁= ∑X₁/n= 405/10= 40.5 years
X[bar]₂= ∑X₁/n= 1290/10= 129 mmHg
Median (Me).
The median is a measure of central tendency that indicates the midpoint of the sample, i.e. divides the sample in exactly 50%. Like the mean, it takes a value within the definition range of the variable but it doesn't necessarily coincide with on observed value.
The first step is to calculate the position of the median.
For even samples the position is n/2, in this case PosMe= 10/2= 5
Second step is to order the values of the variable from lowest to highest, and then indentify the 5th value of the variable:
X₁ ordered: 15, 20, 25, 30, 35, 40, 50, 55, 60, 75
Me₁= 35 years
X₂ ordered: 110; 115; 120; 120; 125; 135; 140; 140; 140; 145
Me₂= 125 mmHg
Mode (Md).
The mode indicates the value of the variable, observed or not, that corresponds to the highest absolute frequency.
X₁: 20; 30; 35; 25; 55; 60; 75; 15; 50; 40
For this variable, all observed values occur only once, which means it has no mode. Md₁= ∅
X₂: 115; 140; 125; 110; 140; 135; 145; 120; 140; 120
140mmHg is the observed value with higher absolute frequency so it is the modal value.
Md₂= 140 mmHg
Variance (S²) and Standard deviation (S).
These two values are measurements of dispersion, they show you the distribution of the values of the variable in regards to the mean.
![S^2= \frac{1}{n-1}[sumX^2-\frac{(sumX)^2}{n} ]](/tpl/images/0520/0929/61847.png)
For X₁
![S^2_1= \frac{1}{9}[19725-\frac{(405)^2}{10} ] = 369.16 years^2](/tpl/images/0520/0929/c2082.png)
S₁= 19.21 years
For X₂
![S^2_2= \frac{1}{9}[167800-\frac{(1290)^2}{10} ]= 154.44mmHg^2](/tpl/images/0520/0929/9448c.png)
S₂= 12.43 mmHg
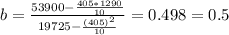
Covariance (CoV)
Covariance is a measure of the joint variability of both variables. You can calculate it using the following formula:


Correlation coeficient (r)
This coefficient shows the type and strength of the correlation between two variables. -1 < r < 1, the closer this coefficient is to I1I the stronger is the association between the variables. If it's negative, it indicates that when one of the variables increases, the other decreases (negative correlation). If it's positive it indicates that both variables increase jointly (positive correlation) If it is equal to zero it means that there is no correlation between the two variables.
To calculate it you can use the following formula:
![r_{X_1X_2}= \frac{1655}{\sqrt{[19725-\frac{405^2}{10} ][167800-\frac{1290^2}{10} ]} }](/tpl/images/0520/0929/bf8bc.png)

The correlation coefficient indicates that there is a good positive correlation between the age of the individuals and their systolic pressure.
b.
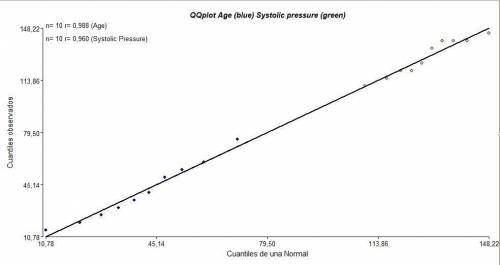
I've made a QQ-plot for both variables (see attachment) as you can see both variables adjust with a high degree to the normal theoretical quantiles which means that both variables show a normal distribution.
c.
I'll use the systolic pressure as Y and the age as X.
a= 129 - 0.5*40.5 = 108.75 mmHg
The estimated average systolic pressure is 108.75 mmHg when the individual's age is zero.
0.5mmHg/years in the modification of the estimated average systolic pressure of the individuals when the age of the individual's increases in one year.
d.
The coefficient of determination of this regression is R²= 0.59 or 59% it shows the degree of the variability of the systolic pressure that is explained by the age of the individuals under the estimated model Yi= 108.75 + 0.5Xi. It takes values between 0 and 100%. The closer the value of the coefficient to 100%, the better is the regression model.
This model is not good, maybe age alone isn't good to explain the variations in the systolic pressure and other variables should be taken into account or other confounding factors need to be controlled.
The standard error of the regression shows you the difference between each observation and the regression line, the closer the data is to the regression line, the smaller is the standard error and the better is the model. In this case, the standard error of the regression is Se= 8.41, this means that each observation of the data set is ±8.41 away from the regression line, this value is quite high and it also shows that the regression model isn't very good.
I hope it helps!