
Mathematics, 26.02.2020 20:45 jbismyhusbandbae
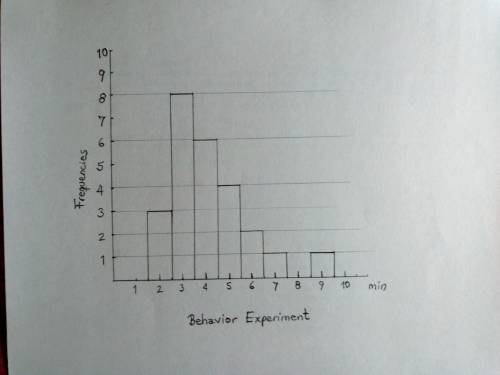
The histogram below shows the distribution of times, in minutes, required for 25 rats in an animal behavior experiment to navigate a maze successfully. The histogram has 8 intervals, each with a width of 1 minute and with midpoints at 2, 3, 4, ..., and 9 minutes. The frequencies are 3, 8, 6, 4, 2, 1, 0, and 1.To describe the center and spread of the above distribution, the appropriate numerical measures are:a. the mean and the standard deviationb. the mean and the medianc. the median and the IQRd. the IQR and the standard deviatione. Any of the above would be appropriate, it is just a matter of taste.

Answers: 1
Another question on Mathematics
Mathematics, 21.06.2019 18:30
What is the perimeter of a rectangular building that is 80 feet wide and 140 feet deep?
Answers: 1
Mathematics, 21.06.2019 20:20
The polynomial 10x3 + 35x2 - 4x - 14 is factored by grouping. 10x3 + 35x2 - 4x - 14 5x )-20 what is the common factor that is missing from both sets of parentheses?
Answers: 2
Mathematics, 22.06.2019 00:00
The construction of copying qpr is started below. the next step is to set the width of the compass to the length of ab. how does this step ensure that a new angle will be congruent to the original angle?
Answers: 1
Mathematics, 22.06.2019 02:30
Adoughnut shop charges $0.50 for each doughnut and $1 for a carryout box. shirley has $10 to spend. which inequality can be used to find d, the number of doughnuts she could have bought if she also wants them in one carryout box?
Answers: 1
You know the right answer?
The histogram below shows the distribution of times, in minutes, required for 25 rats in an animal b...
Questions


Computers and Technology, 27.03.2020 00:23


Mathematics, 27.03.2020 00:23
Health, 27.03.2020 00:23


