
Mathematics, 28.02.2020 22:51 osmanysalvador9
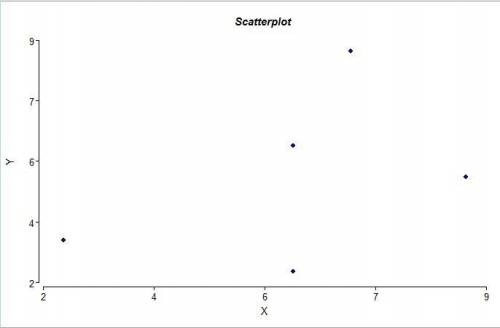
For the accompanying data set, draw a scatter diagram of the data. x 2 6 6 7 9y 3 2 6 9 5B. by hand compute the correlation coefficient. r = (round to three decimals as needed.)C. Fill in the blanks: Because the correlation coefficient is (positive or negative) and the absolute value of the correlation coefficient, , is (greater or not greater) than the critical value for this data set,___, (no, a positive, or a negative) linear relation exists between x and y. (round to three decimal places as needed.)Critical values for the correlation coefficient tablen 3 0.9974 0.9505 0.8786 0.8117 0.7548 0.7079 0.66610 0.63211 0.60212 0.57613 0.55314 0.53215 0.51416 0.49717 0.48218 0.46819 0.45620 0.44421 0.43322 0.42323 0.41324 0.40425 0.39626 0.38827 0.38128 0.37429 0.36730 0.361

Answers: 2
![r= \frac{sumXY-\frac{(sumX)(sumY)}{n} }{\sqrt{[sumX^2-\frac{(sumX)^2}{n} ][sumY^2-\frac{(sumY)^2}{n} ]} }](/tpl/images/0528/6572/d1180.png)
![r= \frac{162-\frac{(30)*(25)}{5} }{\sqrt{[206-\frac{(30)^2}{5} ][155-\frac{(25)^2}{5} ]} }](/tpl/images/0528/6572/6af60.png)
Another question on Mathematics
Mathematics, 21.06.2019 15:10
Which of the following is a proper fraction? a. 9⁄8 b. 5⁄6 c. 7⁄3 d. 4⁄2
Answers: 2
Mathematics, 21.06.2019 17:40
Which of the following are accepted without proof in a logical system? check all that apply.
Answers: 1
Mathematics, 21.06.2019 18:00
For a field trip to the zoo, 4 students rode in cars and the rest filled nine busess. how many students were in each bus if 472 students were on the trip
Answers: 1
You know the right answer?
For the accompanying data set, draw a scatter diagram of the data. x 2 6 6 7 9y 3 2 6 9 5B. by hand...
Questions

Health, 11.10.2019 08:31

History, 11.10.2019 08:31
Mathematics, 11.10.2019 08:31

Biology, 11.10.2019 08:31

Social Studies, 11.10.2019 08:31

Physics, 11.10.2019 08:31
History, 11.10.2019 08:31
Mathematics, 11.10.2019 08:31

Mathematics, 11.10.2019 08:31
Health, 11.10.2019 08:31

Biology, 11.10.2019 08:31


