
Mathematics, 02.03.2020 22:45 pineapplepizaaaaa
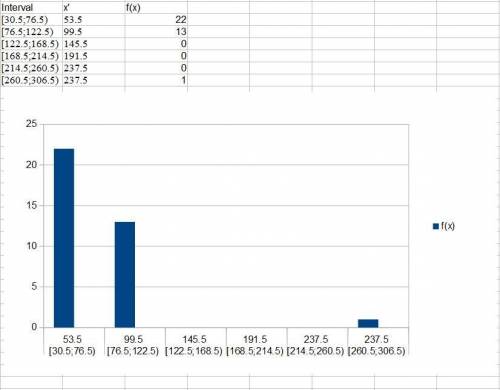
The following data represent salaries, in thousands of dollars, for employees of a small company. Notice the data have been sorted in increasing order.
54 55 55 57 57 59 60 65 65 65 66 68 68 69 69 70 70 70 75 75 75 75 77 82 82 82 88 89 89 91 91 97 98 98 98 280
Make a histogram using the class boundaries 53.5, 99.5, 145.5, 191.5, 237.5, 283.5.

Answers: 1
Another question on Mathematics
Mathematics, 21.06.2019 13:20
What additional information could be used to prove that δxyz ≅ δfeg using asa or aas? check all that apply. ∠z ≅ ∠g and xz ≅ fg ∠z ≅ ∠g and ∠y ≅ ∠e xz ≅ fg and zy ≅ ge xy ≅ ef and zy ≅ fg ∠z ≅ ∠g and xy ≅ fe
Answers: 2
Mathematics, 21.06.2019 16:00
Solve for x -2.3(r - 1.2 ) = -9.66 enter you answer as decimal.
Answers: 1
You know the right answer?
The following data represent salaries, in thousands of dollars, for employees of a small company. No...
Questions

English, 29.07.2019 12:40
English, 29.07.2019 12:40
English, 29.07.2019 12:40

Computers and Technology, 29.07.2019 12:40
Computers and Technology, 29.07.2019 12:40

Mathematics, 29.07.2019 12:40

World Languages, 29.07.2019 12:40

Business, 29.07.2019 12:40

Health, 29.07.2019 12:40

Biology, 29.07.2019 12:40
Health, 29.07.2019 12:40
Computers and Technology, 29.07.2019 12:40
English, 29.07.2019 12:40
English, 29.07.2019 12:40


