
Mathematics, 03.03.2020 04:27 lin550
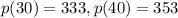
The US Census lists the population of the United States as 249 million in 1990, 281 million in 2000, and 309 million in 2010. Fit a second-degree polynomial P(t)=a_{2}t^{2}+a_{1}t+a_{0} passing through these points, where t represents years after 1990 (so t=0 corresponds to 1990) and P(t) represents population in millions (so P(0)=249). Sketch the parabola, P(t). Use the model to predict the population in the years 2020 and 2030. (Source: US Census Bureau). You may use technology to solve the system of 3 equations and 3 unknowns used to find your coefficients/constants for your model. The setup of your 3x3 linear system must be shown.

Answers: 2
 is the year and
  is the population according to US census, measured in millions. That is to say:
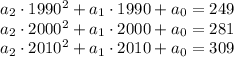

 , where
  when
when  .
.

Another question on Mathematics
Mathematics, 21.06.2019 16:50
What is the perimeter of square abcd? units units 28 units 37 units
Answers: 2
Mathematics, 21.06.2019 17:10
The number of chocolate chips in an 18-ounce bag of chocolate chip cookies is approximately normally distributed with a mean of 1252 chips and standard deviation 129 chips. (a) what is the probability that a randomly selected bag contains between 1100 and 1500 chocolate chips, inclusive? (b) what is the probability that a randomly selected bag contains fewer than 1125 chocolate chips? (c) what proportion of bags contains more than 1225 chocolate chips? (d) what is the percentile rank of a bag that contains 1425 chocolate chips?
Answers: 1
You know the right answer?
The US Census lists the population of the United States as 249 million in 1990, 281 million in 2000,...
Questions
Mathematics, 22.06.2019 11:30

Social Studies, 22.06.2019 11:30
Social Studies, 22.06.2019 11:30

English, 22.06.2019 11:30


Mathematics, 22.06.2019 11:30

Biology, 22.06.2019 11:30
English, 22.06.2019 11:30

Computers and Technology, 22.06.2019 11:30
English, 22.06.2019 11:30


