
Mathematics, 07.03.2020 04:18 derisepicowe0fa
An experiment was conducted to determine the effect of children participating in a given meal preparation on calorie intake for that meal. Data are recorded below. Save the data to a format that can be read into R. Read the data in for analysis. Use R to calculate the quantities and generate the visual summaries requested below. You will lose points if you are not utilizing R.
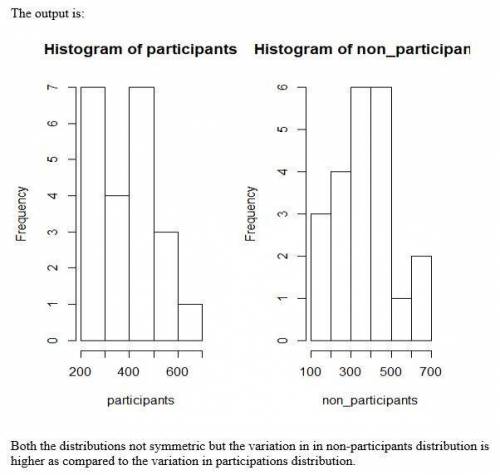
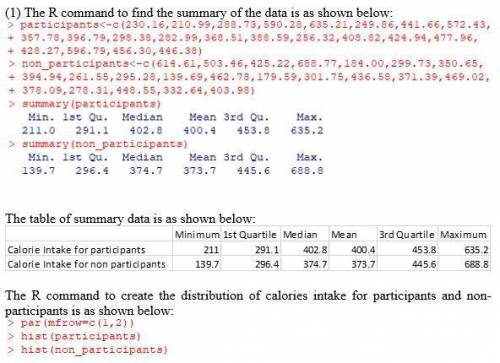
(1) Summarize the data by whether children participated in the meal preparation or not. Use an appropriately labelled table to show the results. Also include a graphical presentation that shows the distribution of calories for participants vs. non-participants. Describe the shape of each distribution and comment on the similarity (or lack thereof) between the distributions in each population. (2 points)
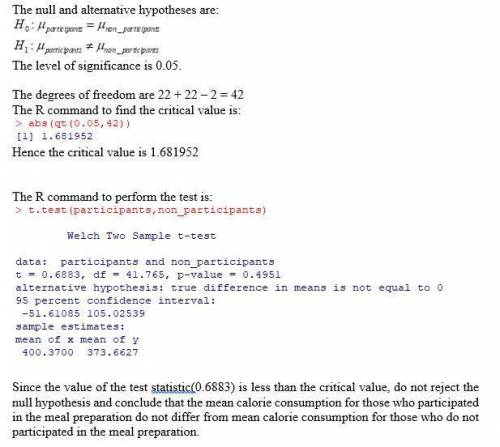
(2) Does the mean calorie consumption for those who participated in the meal preparation differ from 425? Formally test at the alpha = 0.05 level using the 5 steps outlined in the module. (6 points)
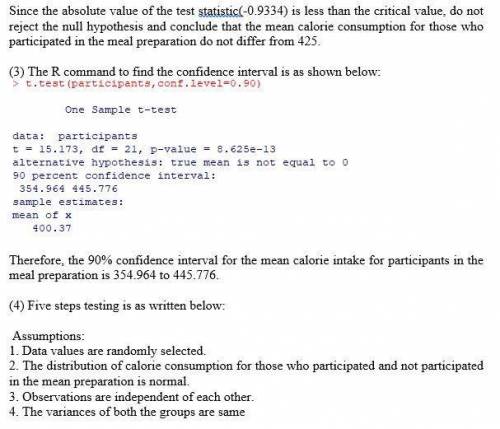
(3) Calculate a 90% confidence interval for the mean calorie intake for participants in the meal preparation. Interpret the confidence interval. (4 points)
(4) Formally test whether or not participants consumed more calories than non-participants at the alpha = 0.05 level using the 5 steps outlined in the module. (6 points )
(5) Are the assumptions of the test used in (4) met? How do you know? (2 points)
Data Set for Assignment 2
Calorie Intake for participants
230.16
210.99
288.73
590.28
582.59
635.21
249.86
441.66
572.43
357.78
396.79
298.38
282.99
368.51
388.59
256.32
408.82
424.94
477.96
428.74
432.52
428.27
596.79
456.30
446.38
Calorie intake for non-participants
614.61
503.46
425.22
688.77
184.00
299.73
350.65
394.94
261.55
295.28
139.69
462.78
179.59
301.75
436.58
371.39
469.02
378.09
287.31
448.55
332.64
403.98

Answers: 1

Another question on Mathematics
Mathematics, 21.06.2019 16:00
Answer asap ! the shortest path from point a to point b goes through a pond. to avoid the pond, you must walk straight 34 meters along one edge of the pond, then take a 90 degree turn, and again walk straight 41 meters along another edge of the pond to reach point b. about how many meters would be saved if it were possible to walk through the pond? a. 11 m b. 20 m c. 30.45 m d. 21.73 m
Answers: 1
Mathematics, 21.06.2019 19:10
Which graph represents the function g(x) = |x + 4| + 2?
Answers: 1
Mathematics, 21.06.2019 19:30
Cor d? ? me ? max recorded the heights of 500 male humans. he found that the heights were normally distributed around a mean of 177 centimeters. which statements about max’s data must be true? a) the median of max’s data is 250 b) more than half of the data points max recorded were 177 centimeters. c) a data point chosen at random is as likely to be above the mean as it is to be below the mean. d) every height within three standard deviations of the mean is equally likely to be chosen if a data point is selected at random.
Answers: 1
You know the right answer?
An experiment was conducted to determine the effect of children participating in a given meal prepar...
Questions


Mathematics, 23.08.2019 15:30

Mathematics, 23.08.2019 15:30
Mathematics, 23.08.2019 15:30


Chemistry, 23.08.2019 15:30

Social Studies, 23.08.2019 15:30
Mathematics, 23.08.2019 15:30

History, 23.08.2019 15:30


