
Mathematics, 07.03.2020 04:04 1Slowbow
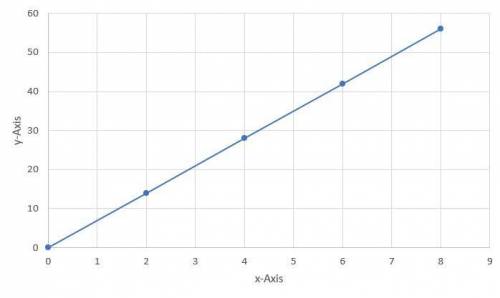
Which graph shows a proportional relationship between the number of hours of renting a bike and the total amount spent to rent the bike? A graph is shown. The values on the x axis are 0, 2, 4, 6, 8, 10. The values on the y axis are 0, 14, 28, 42, 56, and 70. Points are shown on ordered pairs 0, 0 and 2, 14 and 4, 28 and 6, 32 and 8, 44. These points are connected by a line. The label on the x axis is Number of Hours. The title on the y axis is Total Amount in dollars. A graph is shown. The values on the x axis are 0, 2, 4, 6, 8, 10. The values on the y axis are 0, 10, 20, 30, 40, and 50. Points are shown on ordered pairs 0, 0 and 2, 10 and 4, 20 and 6, 42 and 8, 56. These points are connected by a line. The label on the x axis is Number of Hours. The title on the y axis is Total Amount in dollars. A graph is shown. The values on the x axis are 0, 2, 4, 6, 8, 10. The values on the y axis are 0, 14, 28, 42, 56, and 70. Points are shown on ordered pairs 0, 0 and 2, 14 and 4, 28 and 6, 35 and 8, 44. These points are connected by a line. The label on the x axis is Number of Hours. The title on the y axis is Total Amount in dollars. A graph is shown. The values on the x axis are 0, 2, 4, 6, 8, 10. The values on the y axis are 0, 14, 28, 42, 56, and 70. Points are shown on ordered pairs 0, 0 and 2, 14 and 4, 14 and 6, 14 and 8, 14. These points are connected by a line. The label on the x axis is Number of Hours. The title on the y axis is Total Amount in dollars.

Answers: 1
Another question on Mathematics
Mathematics, 21.06.2019 17:50
On a string instrument, the length of a string varies inversely as the frequency of its vibrations. an 11-inch string has a frequency of 400 cylces per second. find the frequency of a 10-icnch string.
Answers: 2
Mathematics, 21.06.2019 23:40
For a science project, a high school research team conducted a survey of local air temperatures. based on the results of the survey, the found that the average temperatures were around 10 degrees higher than expected. this result was wrong. the trouble with the survey was that most of the locations were exposed to direct sunlight and located over asphalt or sand, which resulted in higher temperatures than normal. this is a classic example of an error in which phase of inferential statistics?
Answers: 1
Mathematics, 22.06.2019 00:30
Which ordered pair identifies a point in quadrant iv? a) (2, 5) b) (0, 1) c) (-1, -1) d) (12, -5) which quadrant is (-4,-6) in? a) i. b) ii. c) iii. d) iv.
Answers: 3
Mathematics, 22.06.2019 02:00
The table shows values for functions f(x) and g(x) . x f(x)=−4x−3 g(x)=−3x+1+2 −3 9 179 −2 5 53 −1 1 1 0 −3 −1 1 −7 −7 2 −11 −25 3 −15 −79 what is the solution to f(x)=g(x) ? select each correct answer.
Answers: 1
You know the right answer?
Which graph shows a proportional relationship between the number of hours of renting a bike and the...
Questions
Mathematics, 22.01.2021 21:50

History, 22.01.2021 21:50

Spanish, 22.01.2021 21:50

Physics, 22.01.2021 21:50
History, 22.01.2021 21:50
Mathematics, 22.01.2021 21:50
Mathematics, 22.01.2021 21:50


Business, 22.01.2021 21:50
History, 22.01.2021 21:50
Mathematics, 22.01.2021 21:50


