
Mathematics, 07.03.2020 04:02 hannahkharel2
Each year about 1500 students take the introductory statistics course at a large university. This year scores on the nal exam are distributed with a median of 74 points, a mean of 70 points, and a standard deviation of 10 points. There are no students who scored above 100 (the maximum score attainable on the nal) but a few students scored below 20 points.
(a) Is the distribution of scores on this nal exam symmetric, right skewed, or left skewed?
(b) Would you expect most students to have scored above or below 70 points?
(c) Can we calculate the probability that a randomly chosen student scored above 75 using the normal distribution?
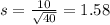
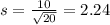
(d) What is the probability that the average score for a random sample of 40 students is above 75?
(e) How would cutting the sample size in half aect the standard error of the mean?

Answers: 3
 and standard deviation
  , the zscore of a measure X is given by:


Another question on Mathematics
Mathematics, 20.06.2019 18:02
On a trip, you had to change your money from dollars to british pounds. you got 560 pounds for 800 dollars. which is a unit rate that describes the exchange
Answers: 1
Mathematics, 21.06.2019 15:00
Hye ryung is the president of the local chapter of the american medical students association (amsa). she is organizing local outreach and informational meetings. at her first meeting there are five people present (including herself). every month after that her group grows by 5 people. a. how many members are in the group after 6 months? b. the logistics of hosting and feeding her group at meetings was more complicated than expected. the cost of feeding 5 people at her first meeting was $30, for 10 people it was $35, for 15 it was $45, and after 6 months all of the costs had added up to $100. write a function to model the cost with the number of people attending meetings. c. what connections can you make between the linear growth of the group’s membership and the increasing costs of running meetings?
Answers: 3
Mathematics, 21.06.2019 18:00
What does the relationship between the mean and median reveal about the shape of the data
Answers: 1
You know the right answer?
Each year about 1500 students take the introductory statistics course at a large university. This ye...
Questions

Mathematics, 12.10.2020 17:01
Mathematics, 12.10.2020 17:01

Social Studies, 12.10.2020 17:01
Mathematics, 12.10.2020 17:01

Health, 12.10.2020 17:01

Mathematics, 12.10.2020 17:01
Social Studies, 12.10.2020 17:01

Biology, 12.10.2020 17:01
History, 12.10.2020 17:01


