
Mathematics, 07.03.2020 04:35 hunterbrod71
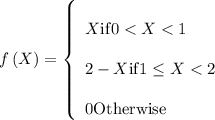
The time, in 100 hours, that a student uses her game console over a year is a random variable X with probability density function
f(x) = { x if 0 2-x if 1<=x<2
0 otherwise}
The power (in number of kilowatt hours) expended by the student's game console each year is 48X^2+26. For these problems, please ensure your answers are accurate to within 3 decimals.
Part a)
Find the mean amount of power expended by the student's game console per year.
Part b)
Find the variance of power expended by the student's game console per year.

Answers: 3

![\begin{array}{c}\\E\left( {{X^2}} \right) = \int\limits_0^1 {\left( {{x^2} \times x} \right)} \,\,dx + \int\limits_1^2 {{x^2}\left( {2 - x} \right)} \,\,dx\\\\ = \int\limits_0^1 {{x^3}} \,\,dx + \int\limits_1^2 {\left( {2{x^2} - {x^3}} \right)} \,\,dx\\\\ = \frac{1}{4}\left[ {{x^4}} \right] + \left[ {2\left[ {\frac{{{x^3}}}{3}} \right]_1^2 - \left[ {\frac{{{x^4}}}{4}} \right]_1^2} \right]\\\\ = \frac{1}{4} + \left[ {\frac{2}{3}\left( {{2^3} - {1^3}} \right) - \frac{1}{4}\left( {{2^4} - {1^4}} \right)} \right]=1.167\\\end{array}](/tpl/images/0537/7023/6e51f.png)
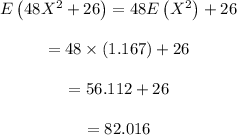
![\begin{array}{c}\\V\left( {48{X^2} + 26} \right) = {\left( {48} \right)^2}V\left( {{X^2}} \right)\\\\ = {48^2}\left( {E\left( {{X^4}} \right) - {{\left[ {E\left( {{X^2}} \right)} \right]}^2}} \right)\\\end{array}](/tpl/images/0537/7023/46510.png)
![\begin{array}{c}\\E\left( {{X^4}} \right) = \int\limits_0^1 {\left( {{x^4} \times x} \right)} \,\,dx + \int\limits_1^2 {{x^4}\left( {2 - x} \right)} \,\,dx\\\\ = \int\limits_0^1 {{x^4}} \,\,dx + \int\limits_1^2 {\left( {2{x^4} - {x^5}} \right)} \,\,dx\\\\ = \frac{1}{5}\left[ {{x^5}} \right]_0^1 + \left[ {2\left[ {\frac{{{x^5}}}{5}} \right]_1^2 - \left[ {\frac{{{x^6}}}{6}} \right]_1^2} \right]\\\\ = \frac{1}{5} + \left[ {\frac{2}{5}\left( {{2^5} - {1^5}} \right) - \frac{1}{6}\left( {{2^6} - {1^6}} \right)} \right]=2.1\\\end{array}](/tpl/images/0537/7023/dd02e.png)
![\begin{array}{c}\\V\left( {{X^2}} \right) = E\left( {{X^4}} \right) - {\left[ {E\left( {{X^2}} \right)} \right]^2}\\\\ = 2.1 - {\left( {1.167} \right)^2}\\\\ = 0.738\\\end{array}](/tpl/images/0537/7023/7cdf3.png)
Another question on Mathematics
Mathematics, 20.06.2019 18:04
Fran would like to estimate the mean amount of time it takes people in her town to travel to work. the town's population is 150,000 and about 90,000 of those are working adults. which statements are true? select each correct answer. there is no way to infer the value of the mean. she must collect data for all 90,000 working adults and calculate the mean. a larger sample of working adults will provide a better estimate of the true mean than a smaller sample. the population of working adults is too large for using a sample to estimate the mean of the entire group. if she takes a random sample of the population of working adults in her town, the mean for that group is likely close to the mean for the entire group.
Answers: 2
Mathematics, 21.06.2019 16:30
You drop a rubber ball off the roof of a 50 meter high building onto a paved parking lot. it bounces back up with every bounce, but not quite all the way back up to you. after the first bounce it bounces back only 80 percent of the distance it was dropped from. the pattern continues, meaning after every bounce it comes up to just 80 percent of the previous maximum height. so if before the first bounce the height is 50 meters, what height does the ball reach after the fifth bounce? round your answer to one decimal place and chose the correct response from the choices below:
Answers: 1
Mathematics, 21.06.2019 18:00
Suppose you are going to graph the data in the table. minutes temperature (°c) 0 -2 1 1 2 3 3 4 4 5 5 -4 6 2 7 -3 what data should be represented on each axis, and what should the axis increments be? x-axis: minutes in increments of 1; y-axis: temperature in increments of 5 x-axis: temperature in increments of 5; y-axis: minutes in increments of 1 x-axis: minutes in increments of 1; y-axis: temperature in increments of 1 x-axis: temperature in increments of 1; y-axis: minutes in increments of 5
Answers: 2
Mathematics, 21.06.2019 21:20
If f(x) = 4 - x2 and g(x) = 6x, which expression is equivalent to (g-f)(3)? 06-3-(4 + 3)2 06-3-(4-33 6(3) - 4 +32 6(3) -4 -32
Answers: 1
You know the right answer?
The time, in 100 hours, that a student uses her game console over a year is a random variable X with...
Questions


English, 24.04.2020 12:51
Mathematics, 24.04.2020 12:52
Engineering, 24.04.2020 12:52

Social Studies, 24.04.2020 12:52

Physics, 24.04.2020 12:52
Mathematics, 24.04.2020 12:52

Mathematics, 24.04.2020 12:52
Mathematics, 24.04.2020 12:52

Geography, 24.04.2020 12:52


