C. Analyze the given box-and-whisker plot, which displays the heights of 40 randomly chosen
ad...

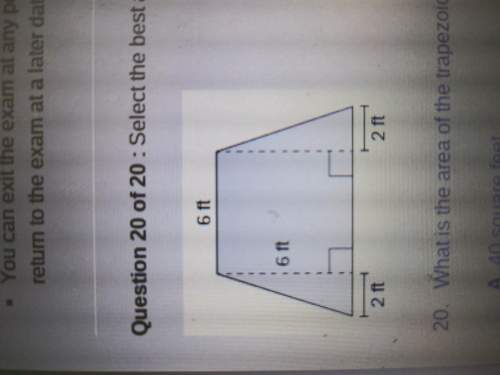
Mathematics, 12.03.2020 02:57 ilovefood2064
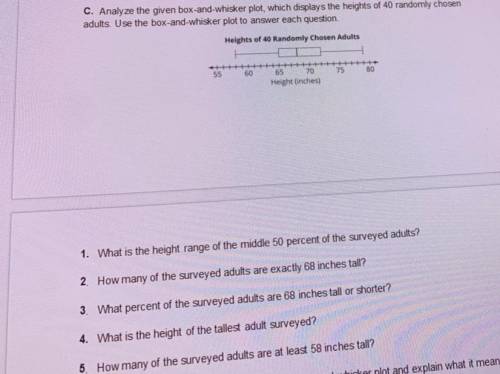
C. Analyze the given box-and-whisker plot, which displays the heights of 40 randomly chosen
adults. Use the box-and-whisker plot to answer each question.
Heights of 40 Randomly Chosen Adults
+
1. What is the height range of the middle 50 percent of the surveyed adults?
2. How many of the surveyed adults are exactly 68 inches tall?
3. What percent of the surveyed adults are 68 inches tall or shorter?
4. What is the height of the tallest adult surveyed?
5. How many of the surveyed adults are at least 58 inches tall?
6. Describe the distribution of the data in the box-and-whisker plot and explain what it means in
terms of the problem situation

Answers: 1
Another question on Mathematics
Mathematics, 21.06.2019 15:30
Click on the y intercept. -x +4 i know you cant click on it so could you just say the coordinates like (example - (1,0) you so much.
Answers: 2
Mathematics, 21.06.2019 21:50
In a singing competition, there are 150 participants. at the end of each round, 40% of the participants are eliminated. how many participants are left after n rounds?
Answers: 1
Mathematics, 21.06.2019 22:10
Erinn wrote the equation –5x + 4y = 32 to represent her hourly wage (y) and how this wage has changed during each year that she worked at a company (x). what is the rate of change in erinn's hourly wage per year?
Answers: 2
You know the right answer?
Questions

Mathematics, 13.12.2020 03:00
Mathematics, 13.12.2020 03:00

History, 13.12.2020 03:00

Computers and Technology, 13.12.2020 03:00
Mathematics, 13.12.2020 03:00

Physics, 13.12.2020 03:00
Mathematics, 13.12.2020 03:00

Spanish, 13.12.2020 03:00

Law, 13.12.2020 03:00

Social Studies, 13.12.2020 03:00
Mathematics, 13.12.2020 03:00
Spanish, 13.12.2020 03:00
History, 13.12.2020 03:00


