Determine the equation for the line of best fit to represent the data.
scatter plot with...

Mathematics, 17.03.2020 22:18 superkitty003
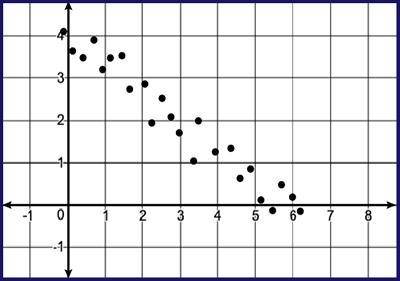
Determine the equation for the line of best fit to represent the data.
scatter plot with points going down from about zero comma 4 to the right to about 7 comma zero
y equals two thirds times x plus 4
y equals negative two thirds times x plus 4
y equals negative three halves times x plus 4
y equals negative two thirds times x minus 4

Answers: 3
Another question on Mathematics
Mathematics, 22.06.2019 02:00
Aculinary club earns $1360 from a dinner service. they sold 45 adult meals and 80 student meals. an adult meal costs twice as much as a student meal. what is the cost of an adult meal?
Answers: 2
Mathematics, 22.06.2019 02:00
Student representatives surveyed their classmates on their preference of a school mascot for a new school. the results are shown in the table below. which pair of samples seems most representative of student preference?
Answers: 2
Mathematics, 22.06.2019 03:00
Atest of sobriety involves measuring the subject's motor skills. a sample of 31 randomly selected sober subjects take the test and produce a mean score of 64.4 with a standard deviation of 2. a claim is made that the true mean score for all sober subjects is equal to 65. for each part below, enter only a numeric value in the answer box. for example, do not type "z =" or "t =" before your answers. round each of your answers to 3 places after the decimal point. (a) calculate the value of the test statistic used in this test. test statistic's value = (b) use your calculator to find the p-value of this test. p-value = (c) use your calculator to find the critical value(s) used to test this claim at the 0.2 significance level. if there are two critical values, then list them both with a comma between them. critical value(s) =
Answers: 2
You know the right answer?
Questions
Mathematics, 29.07.2020 03:01
Mathematics, 29.07.2020 03:01
Mathematics, 29.07.2020 03:01


English, 29.07.2020 03:01
Mathematics, 29.07.2020 03:01
Mathematics, 29.07.2020 03:01

Social Studies, 29.07.2020 03:01

Computers and Technology, 29.07.2020 03:01


