
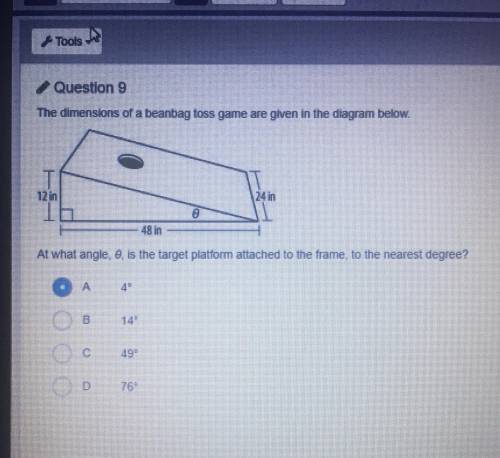
The dimensions of a beanbag toss game are given in the diagram belew.
At what angle, the...

Mathematics, 20.03.2020 23:57 natalie2sheffield
The dimensions of a beanbag toss game are given in the diagram belew.
At what angle, theta, is the target platform attached to the frame, to the nearest degree?
(Solve using trigonometric ratios btw)

Answers: 2
Another question on Mathematics
Mathematics, 21.06.2019 15:30
Arestaurant needs to buy thirty-seven new plates. if each box has five plates in it, how many boxes will they need to buy?
Answers: 1
Mathematics, 21.06.2019 16:00
Part one: measurements 1. measure your own height and arm span (from finger-tip to finger-tip) in inches. you will likely need some from a parent, guardian, or sibling to get accurate measurements. record your measurements on the "data record" document. use the "data record" to you complete part two of this project. name relationship to student x height in inches y arm span in inches archie dad 72 72 ginelle mom 65 66 sarah sister 64 65 meleah sister 66 3/4 67 rachel sister 53 1/2 53 emily auntie 66 1/2 66 hannah myself 66 1/2 69 part two: representation of data with plots 1. using graphing software of your choice, create a scatter plot of your data. predict the line of best fit, and sketch it on your graph. part three: the line of best fit include your scatter plot and the answers to the following questions in your word processing document 1. 1. which variable did you plot on the x-axis, and which variable did you plot on the y-axis? explain why you assigned the variables in that way. 2. write the equation of the line of best fit using the slope-intercept formula $y = mx + b$. show all your work, including the points used to determine the slope and how the equation was determined. 3. what does the slope of the line represent within the context of your graph? what does the y-intercept represent? 5. use the line of best fit to you to describe the data correlation.
Answers: 2
Mathematics, 21.06.2019 16:20
Browning labs is testing a new growth inhibitor for a certain type of bacteria. the bacteria naturally grows exponentially each hour at a rate of 6.2%. the researchers know that the inhibitor will make the growth rate of the bacteria less than or equal to its natural growth rate. the sample currently contains 100 bacteria.the container holding the sample can hold only 300 bacteria, after which the sample will no longer grow. however, the researchers are increasing the size of the container at a constant rate allowing the container to hold 100 more bacteria each hour. they would like to determine the possible number of bacteria in the container over time.create a system of inequalities to model the situation above, and use it to determine how many of the solutions are viable.
Answers: 1
Mathematics, 21.06.2019 20:00
Elizabeth is using a sample to study american alligators. she plots the lengths of their tails against their total lengths to find the relationship between the two attributes. which point is an outlier in this data set?
Answers: 1
You know the right answer?
Questions
Mathematics, 26.11.2021 07:50

English, 26.11.2021 08:00

History, 26.11.2021 08:00

Computers and Technology, 26.11.2021 08:00

History, 26.11.2021 08:00

Geography, 26.11.2021 08:00
English, 26.11.2021 08:00

Mathematics, 26.11.2021 08:00
Mathematics, 26.11.2021 08:00
Biology, 26.11.2021 08:00
Mathematics, 26.11.2021 08:10
Mathematics, 26.11.2021 08:10
English, 26.11.2021 08:10
Mathematics, 26.11.2021 08:10

Arts, 26.11.2021 08:10


