Module 06: Project Option 1
Instructions
For this activity, you will need two coins. Fir...

Mathematics, 23.03.2020 23:08 ruthd113
Module 06: Project Option 1
Instructions
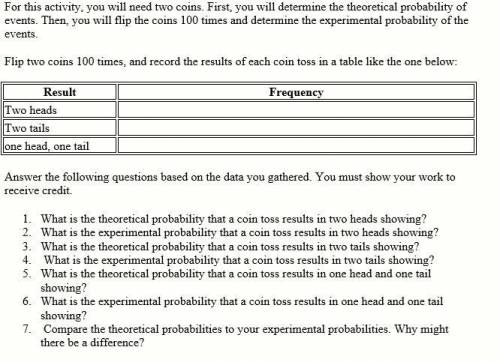
For this activity, you will need two coins. First, you will determine the theoretical probability of events. Then, you will flip the coins 100 times and determine the experimental probability of the events.
Flip two coins 100 times, and record the results of each coin toss in a table like the one below:
Result Frequency
Two heads
Two tails
one head, one tail
Answer the following questions based on the data you gathered. You must show your work to receive credit.
1. What is the theoretical probability that a coin toss results in two heads showing?
2. What is the experimental probability that a coin toss results in two heads showing?
3. What is the theoretical probability that a coin toss results in two tails showing?
4. What is the experimental probability that a coin toss results in two tails showing?
5. What is the theoretical probability that a coin toss results in one head and one tail showing?
6. What is the experimental probability that a coin toss results in one head and one tail showing?
7. Compare the theoretical probabilities to your experimental probabilities. Why might there be a difference?

Answers: 1
Another question on Mathematics
Mathematics, 21.06.2019 13:30
Which graph shows a function with a range of all real numbers greater than or equal to -1
Answers: 3
Mathematics, 21.06.2019 16:30
What could explain what happened when the time was equal to 120 minutes
Answers: 2
Mathematics, 21.06.2019 18:30
Write the slope-intercept form of the line that passes through the point (1, 0) and is parallel to x - y = 7. t
Answers: 2
Mathematics, 21.06.2019 23:00
Each of the following data sets has a mean of x = 10. (i) 8 9 10 11 12 (ii) 7 9 10 11 13 (iii) 7 8 10 12 13 (a) without doing any computations, order the data sets according to increasing value of standard deviations. (i), (iii), (ii) (ii), (i), (iii) (iii), (i), (ii) (iii), (ii), (i) (i), (ii), (iii) (ii), (iii), (i) (b) why do you expect the difference in standard deviations between data sets (i) and (ii) to be greater than the difference in standard deviations between data sets (ii) and (iii)? hint: consider how much the data in the respective sets differ from the mean. the data change between data sets (i) and (ii) increased the squared difference îł(x - x)2 by more than data sets (ii) and (iii). the data change between data sets (ii) and (iii) increased the squared difference îł(x - x)2 by more than data sets (i) and (ii). the data change between data sets (i) and (ii) decreased the squared difference îł(x - x)2 by more than data sets (ii) and (iii). none of the above
Answers: 2
You know the right answer?
Questions

English, 27.04.2021 07:00


History, 27.04.2021 07:00

Computers and Technology, 27.04.2021 07:00

English, 27.04.2021 07:10
Mathematics, 27.04.2021 07:10
Chemistry, 27.04.2021 07:10
Mathematics, 27.04.2021 07:10
Mathematics, 27.04.2021 07:10
Mathematics, 27.04.2021 07:10

Arts, 27.04.2021 07:10
History, 27.04.2021 07:10
Mathematics, 27.04.2021 07:10


