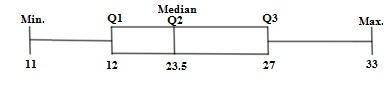
The box-and-whisker plot for the given question is as shown at the attached figure.
Minimum = 11
Lower quartile = Q1 = 12
Median = Q2 = 23.5
Upper quartile = Q3 = 27
Maximum = 33
So, according to the given data and the figure:
The box will go from 12 to 27 ⇒ Q1 to Q3A line dividing the box will go at 23.5 ⇒ Q2The left whisker will go from 11 to 12 ⇒ Minimum to Q1The right whisker will go from to 27 to 33 ⇒ Q2 to Maximum