
Mathematics, 27.03.2020 19:09 BigGirlsTheBest
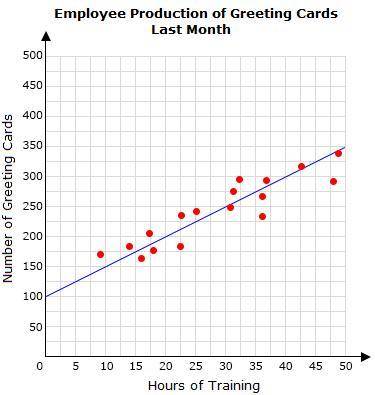
Gilded Gifts Company hires employees to make handmade greeting cards. The manager is determining how the time spent training new employees affects their production of greeting cards. The scatter plot below shows how many greeting cards each employee made the past month and the number of hours of training the employee received. A line of best fit is drawn.
Complete the statements based on the scatter plot.
The slope of the line of best fit is__ . This means that for every additional hour of training, __more greeting cards are expected to be made per month.
Without any training, an employee is expected to make __ greeting cards per month.
If an employee has 70 hours of training, the employee is expected to make __ greeting cards per month.

Answers: 3
Another question on Mathematics
Mathematics, 21.06.2019 17:30
How is the number of vertices for a prism related to the name of the prism
Answers: 1
Mathematics, 21.06.2019 18:20
The number if marbles of different colors stored in a hat is listed below: 4 red marbles 10 green marbles 7 blue marbles. without looking in the hat, dan takes out a marble at random. he replaces the marble and then takes out another marble from the hat. what is the probability that dan takes out a blue marble in both draws?
Answers: 1
Mathematics, 22.06.2019 03:00
Describe how the presence of possible outliers might be identified on the following. (a) histograms gap between the first bar and the rest of bars or between the last bar and the rest of bars large group of bars to the left or right of a gap higher center bar than surrounding bars gap around the center of the histogram higher far left or right bar than surrounding bars (b) dotplots large gap around the center of the data large gap between data on the far left side or the far right side and the rest of the data large groups of data to the left or right of a gap large group of data in the center of the dotplot large group of data on the left or right of the dotplot (c) stem-and-leaf displays several empty stems in the center of the stem-and-leaf display large group of data in stems on one of the far sides of the stem-and-leaf display large group of data near a gap several empty stems after stem including the lowest values or before stem including the highest values large group of data in the center stems (d) box-and-whisker plots data within the fences placed at q1 â’ 1.5(iqr) and at q3 + 1.5(iqr) data beyond the fences placed at q1 â’ 2(iqr) and at q3 + 2(iqr) data within the fences placed at q1 â’ 2(iqr) and at q3 + 2(iqr) data beyond the fences placed at q1 â’ 1.5(iqr) and at q3 + 1.5(iqr) data beyond the fences placed at q1 â’ 1(iqr) and at q3 + 1(iqr)
Answers: 1
Mathematics, 22.06.2019 03:30
Given that the images represent 4 steps in the construction of a line segment congruent to a given line segment, which is step 3 in the construction?
Answers: 1
You know the right answer?
Gilded Gifts Company hires employees to make handmade greeting cards. The manager is determining how...
Questions

English, 23.01.2021 01:20

Biology, 23.01.2021 01:20
Mathematics, 23.01.2021 01:20

Physics, 23.01.2021 01:20
Mathematics, 23.01.2021 01:20

History, 23.01.2021 01:20

Mathematics, 23.01.2021 01:20


